OPEN-SOURCE SCRIPT
Adaptive SuperTrend Oscillator [QuantAlgo]
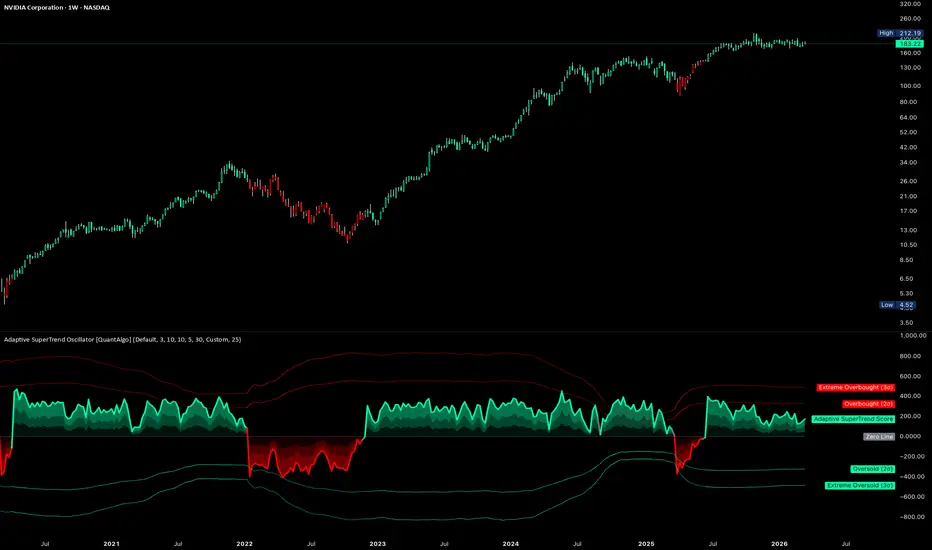
🟢 Overview
The Adaptive SuperTrend Oscillator transforms the classic SuperTrend indicator into a normalized momentum score that adapts to changing market conditions. Instead of displaying a simple above/below signal on the price chart, it measures how far price has moved from the SuperTrend line and scales that distance against an Efficiency Ratio-driven ATR that automatically adjusts between trending and ranging environments. The result is a centered oscillator with dynamically calculated overbought and oversold thresholds, helping traders read the strength behind a trend rather than just its direction, across different markets and timeframes.

🟢 How It Works
The foundation of the indicator is the distance between the closing price and the SuperTrend line:
Pine Script®
A positive distance means price is above the SuperTrend line, indicating a bullish condition. A negative distance indicates price is below it, reflecting a bearish condition. The raw distance alone is not directly comparable across instruments or timeframes, so the indicator normalizes it using an adaptive ATR.
The normalization layer is driven by an Efficiency Ratio, which measures how directionally efficient recent price movement has been. It compares the net price change over the lookback window against the total path length traveled:
Pine Script®
A high Efficiency Ratio means price is moving in a consistent direction with little back-and-forth. A low ratio indicates choppy, non-directional movement. This reading is then used to blend between a fast and slow ATR period:
Pine Script®
During trending conditions the fast ATR period is weighted more heavily, allowing the score to move more freely. During choppy conditions the slow ATR period dominates, dampening the score and reducing low-conviction readings. The final score is expressed as a percentage of the adaptive ATR, making it directly comparable across different instruments and volatility environments.
Overbought and oversold levels are derived dynamically from the rolling standard deviation of the score itself rather than fixed values:
Pine Script®
This means the threshold levels expand during volatile periods and contract during quiet ones, keeping the overbought and oversold zones statistically consistent relative to recent score behavior.

🟢 Signal Interpretation
▶ Bullish Trend (Score Above Zero, Outside Neutral Zone, Green): When the score is positive and exceeds the neutral threshold, the oscillator confirms that price is above the SuperTrend line and momentum is directionally efficient enough to register. The score's gradient intensity reflects how far momentum has extended relative to the adaptive ATR baseline. The trend remains bullish until the score crosses back below zero or into the neutral zone.
▶ Bearish Trend (Score Below Zero, Outside Neutral Zone, Red): When the score is negative and falls below the neutral threshold, the oscillator confirms that price is below the SuperTrend line. A deeper negative score indicates stronger downside momentum relative to the normalization baseline. The trend remains bearish until the score crosses back above zero or into the neutral zone.
▶ Neutral Zone (Score Within Threshold, Grey): When the absolute score value is within the neutral threshold, the oscillator treats the reading as non-directional regardless of which side of zero it sits on. This filters out low-conviction conditions where the SuperTrend distance is small relative to the adaptive ATR, preventing the indicator from registering trend signals during consolidation or choppy price action.
▶ Overbought and Oversold Levels (2σ and 3σ Bands): When the score reaches the 2σ or 3σ bands, it indicates that momentum has extended significantly relative to its own recent history. These are not reversal signals by themselves, but they mark zones where the trend is stretched and worth monitoring for potential exhaustion.

🟢 Features
▶ Preconfigured Presets: Three parameter sets cover different trading approaches. "Default" uses moderate SuperTrend sensitivity for swing trading on 4-hour and daily charts. "Fast Response" tightens the SuperTrend bands and shortens normalization windows for intraday use on 5-minute to 1-hour charts. "Smooth Trend" widens the SuperTrend bands and extends normalization windows for position trading on daily and weekly timeframes.

▶ Built-in Alerts: Seven alert conditions cover the full range of oscillator states. Trend transition alerts fire when the score crosses into bullish, bearish, or neutral territory. Separate alerts trigger when the score reaches the 2σ overbought or oversold levels and again when it reaches the more extreme 3σ levels, enabling graduated monitoring without requiring constant chart observation.

▶ Visual Customization: Six color presets (Classic, Aqua, Cosmic, Cyber, Neon, plus Custom) coordinate colors across the score line, ribbon fills, overbought/oversold bands, and optional bar coloring. The ribbon uses three fill layers between the score line and zero, each at increasing transparency, creating a gradient that visually represents the weight of momentum behind the current reading. Optional bar coloring applies trend state colors directly to price bars for quick multi-timeframe reference.

The Adaptive SuperTrend Oscillator transforms the classic SuperTrend indicator into a normalized momentum score that adapts to changing market conditions. Instead of displaying a simple above/below signal on the price chart, it measures how far price has moved from the SuperTrend line and scales that distance against an Efficiency Ratio-driven ATR that automatically adjusts between trending and ranging environments. The result is a centered oscillator with dynamically calculated overbought and oversold thresholds, helping traders read the strength behind a trend rather than just its direction, across different markets and timeframes.
🟢 How It Works
The foundation of the indicator is the distance between the closing price and the SuperTrend line:
A positive distance means price is above the SuperTrend line, indicating a bullish condition. A negative distance indicates price is below it, reflecting a bearish condition. The raw distance alone is not directly comparable across instruments or timeframes, so the indicator normalizes it using an adaptive ATR.
The normalization layer is driven by an Efficiency Ratio, which measures how directionally efficient recent price movement has been. It compares the net price change over the lookback window against the total path length traveled:
A high Efficiency Ratio means price is moving in a consistent direction with little back-and-forth. A low ratio indicates choppy, non-directional movement. This reading is then used to blend between a fast and slow ATR period:
During trending conditions the fast ATR period is weighted more heavily, allowing the score to move more freely. During choppy conditions the slow ATR period dominates, dampening the score and reducing low-conviction readings. The final score is expressed as a percentage of the adaptive ATR, making it directly comparable across different instruments and volatility environments.
Overbought and oversold levels are derived dynamically from the rolling standard deviation of the score itself rather than fixed values:
This means the threshold levels expand during volatile periods and contract during quiet ones, keeping the overbought and oversold zones statistically consistent relative to recent score behavior.
🟢 Signal Interpretation
▶ Bullish Trend (Score Above Zero, Outside Neutral Zone, Green): When the score is positive and exceeds the neutral threshold, the oscillator confirms that price is above the SuperTrend line and momentum is directionally efficient enough to register. The score's gradient intensity reflects how far momentum has extended relative to the adaptive ATR baseline. The trend remains bullish until the score crosses back below zero or into the neutral zone.
▶ Bearish Trend (Score Below Zero, Outside Neutral Zone, Red): When the score is negative and falls below the neutral threshold, the oscillator confirms that price is below the SuperTrend line. A deeper negative score indicates stronger downside momentum relative to the normalization baseline. The trend remains bearish until the score crosses back above zero or into the neutral zone.
▶ Neutral Zone (Score Within Threshold, Grey): When the absolute score value is within the neutral threshold, the oscillator treats the reading as non-directional regardless of which side of zero it sits on. This filters out low-conviction conditions where the SuperTrend distance is small relative to the adaptive ATR, preventing the indicator from registering trend signals during consolidation or choppy price action.
▶ Overbought and Oversold Levels (2σ and 3σ Bands): When the score reaches the 2σ or 3σ bands, it indicates that momentum has extended significantly relative to its own recent history. These are not reversal signals by themselves, but they mark zones where the trend is stretched and worth monitoring for potential exhaustion.
🟢 Features
▶ Preconfigured Presets: Three parameter sets cover different trading approaches. "Default" uses moderate SuperTrend sensitivity for swing trading on 4-hour and daily charts. "Fast Response" tightens the SuperTrend bands and shortens normalization windows for intraday use on 5-minute to 1-hour charts. "Smooth Trend" widens the SuperTrend bands and extends normalization windows for position trading on daily and weekly timeframes.
▶ Built-in Alerts: Seven alert conditions cover the full range of oscillator states. Trend transition alerts fire when the score crosses into bullish, bearish, or neutral territory. Separate alerts trigger when the score reaches the 2σ overbought or oversold levels and again when it reaches the more extreme 3σ levels, enabling graduated monitoring without requiring constant chart observation.
▶ Visual Customization: Six color presets (Classic, Aqua, Cosmic, Cyber, Neon, plus Custom) coordinate colors across the score line, ribbon fills, overbought/oversold bands, and optional bar coloring. The ribbon uses three fill layers between the score line and zero, each at increasing transparency, creating a gradient that visually represents the weight of momentum behind the current reading. Optional bar coloring applies trend state colors directly to price bars for quick multi-timeframe reference.
오픈 소스 스크립트
트레이딩뷰의 진정한 정신에 따라, 이 스크립트의 작성자는 이를 오픈소스로 공개하여 트레이더들이 기능을 검토하고 검증할 수 있도록 했습니다. 작성자에게 찬사를 보냅니다! 이 코드는 무료로 사용할 수 있지만, 코드를 재게시하는 경우 하우스 룰이 적용된다는 점을 기억하세요.

🟢 Access our best trading & investing tools: joinquantalgo.com/plans
🟢 Free Special Edition indicators: joinquantalgo.com/special-editions
🟢 Discord: discord.gg/hJaFyGEAyX
🟢 Free Special Edition indicators: joinquantalgo.com/special-editions
🟢 Discord: discord.gg/hJaFyGEAyX
면책사항
해당 정보와 게시물은 금융, 투자, 트레이딩 또는 기타 유형의 조언이나 권장 사항으로 간주되지 않으며, 트레이딩뷰에서 제공하거나 보증하는 것이 아닙니다. 자세한 내용은 이용 약관을 참조하세요.
오픈 소스 스크립트
트레이딩뷰의 진정한 정신에 따라, 이 스크립트의 작성자는 이를 오픈소스로 공개하여 트레이더들이 기능을 검토하고 검증할 수 있도록 했습니다. 작성자에게 찬사를 보냅니다! 이 코드는 무료로 사용할 수 있지만, 코드를 재게시하는 경우 하우스 룰이 적용된다는 점을 기억하세요.
🟢 Access our best trading & investing tools: joinquantalgo.com/plans
🟢 Free Special Edition indicators: joinquantalgo.com/special-editions
🟢 Discord: discord.gg/hJaFyGEAyX
🟢 Free Special Edition indicators: joinquantalgo.com/special-editions
🟢 Discord: discord.gg/hJaFyGEAyX
면책사항
해당 정보와 게시물은 금융, 투자, 트레이딩 또는 기타 유형의 조언이나 권장 사항으로 간주되지 않으며, 트레이딩뷰에서 제공하거나 보증하는 것이 아닙니다. 자세한 내용은 이용 약관을 참조하세요.