OPEN-SOURCE SCRIPT
High Volume Pivot Support & Resistance Zones [BigBeluga]
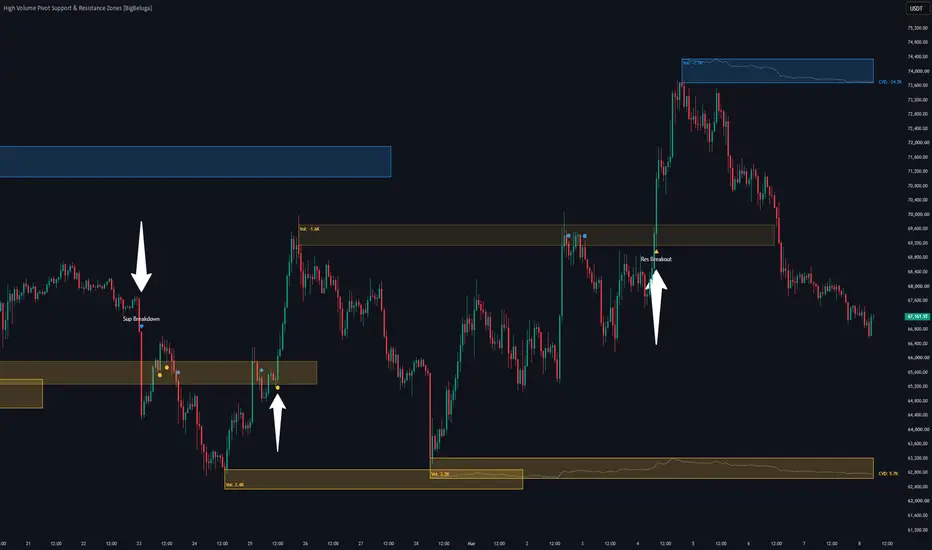
High Volume Pivot Support & Resistance Zones [BigBeluga] is a market-structure indicator built for TradingView. It helps traders find key support and resistance levels by looking for major pivot points backed by institutional volume.
Instead of drawing simple unweighted lines, this tool tracks the volume of swing highs and lows. When a high-volume pivot is found, the script creates a dynamic zone box on your chart and fits a live Cumulative Volume Delta (CVD) trendline inside it. This lets you monitor real-time buying and selling pressure exactly where the market is most likely to reverse.
🔵 MAIN ENGINE & VOLUME ZONE LOGIC
1. Volume-Validated Pivots
2. Embedded Zone CVD Lines
Pine Script®
🔵 DYNAMIC ZONE FLIPS & SIGNALS
1. Support and Resistance Flips
2. Retest and Breakout Plots
Pine Script®
🔵 TRADING STRATEGIES & RISK
🔵 SETTINGS & CONFIGURATION
Clean up your layout and trade with volume-weighted precision using the High Volume Pivot Support & Resistance Zones terminal.
Instead of drawing simple unweighted lines, this tool tracks the volume of swing highs and lows. When a high-volume pivot is found, the script creates a dynamic zone box on your chart and fits a live Cumulative Volume Delta (CVD) trendline inside it. This lets you monitor real-time buying and selling pressure exactly where the market is most likely to reverse.
🔵 MAIN ENGINE & VOLUME ZONE LOGIC
1. Volume-Validated Pivots
- Swing Isolation Fields: The tool uses customizable lookback settings (Resistance/Support Pivot Length) to find prominent structural swing highs and lows.
- Institutional Volume Filters: Every new swing point is checked against a volume baseline (Volume MA Length). A zone is only plotted if the pivot bar's volume beats the baseline multiplier (Volume Threshold Multiplier), filtering out weak retail moves.
2. Embedded Zone CVD Lines
- Intra-Box Order Flow Tracking: The script counts the volume delta (buying volume minus selling volume based on candle closes) from the exact bar the pivot formed.
- Normalized Inside the Box: Using custom polylines, the script scales and plots the rolling CVD trend directly inside the height of the zone box. This lets you see order-flow accumulation without cluttering your screen with bottom dashboard panels.
- Live Labels: A small text readout updates on the leading edge of the box, showing the current net CVD volume.
🔵 DYNAMIC ZONE FLIPS & SIGNALS
1. Support and Resistance Flips
- Automatic Re-Coloring: When a strong candle close breaks entirely through a zone, the script changes its role. Broken resistance boxes switch to your Support Zone Color (yellow), and broken support boxes turn into your Resistance Zone Color (blue).
- Border Style Changes: The box outline instantly switches from a solid line to a dashed line the moment a zone is breached, flagging a clear shift in institutional liquidity.
2. Retest and Breakout Plots
- Breakout Arrows: The system prints clean triangle up or down arrows (▲ or ▼) on your chart labeled "Res Breakout" or "Sup Breakdown" the exact bar a zone boundary fails.
- Proximity Retest Shapes: It plots tiny circle markers when price pulls back to successfully test a normal support/resistance hold. If price tests a broken zone that has reversed roles, it prints a diamond marker to flag an advanced flipped S/R retest.
🔵 TRADING STRATEGIES & RISK
- CVD Absorption Entries: When price rallies up into a blue resistance box, check the internal dotted CVD line.
If price pushes high into the box but the internal CVD trend slopes down, sellers are absorbing the buy orders. This sets up a high-probability short entry. - Flipped Support Re-Entries: When a bullish breakout triggers a "Res Breakout" arrow, wait for price to pull back to the top border of the broken box. A clean bounce marked by a diamond shape confirms the old resistance has flipped to support, offering a safe continuation trade.
- Clear Risk Invalidation floors: You can use the exact borders of the generated boxes to place your stop loss. If you buy a support hold retest, your clear risk invalidation point sits right below the bottom line of that specific support box.
🔵 SETTINGS & CONFIGURATION
- Pivot Geometry Controls: Easily fine-tune lookback lengths and volume multipliers to adapt the indicator for volatile crypto assets, indexes, or liquid forex pairs.
- Visual Zone Overrides: Adjust background colors, transparency levels, and text label sizing to match your dark or light charting interface seamlessly.
Clean up your layout and trade with volume-weighted precision using the High Volume Pivot Support & Resistance Zones terminal.
오픈 소스 스크립트
트레이딩뷰의 진정한 정신에 따라, 이 스크립트의 작성자는 이를 오픈소스로 공개하여 트레이더들이 기능을 검토하고 검증할 수 있도록 했습니다. 작성자에게 찬사를 보냅니다! 이 코드는 무료로 사용할 수 있지만, 코드를 재게시하는 경우 하우스 룰이 적용된다는 점을 기억하세요.

🔵Gain access to our powerful tools : bigbeluga.com/tv
🔵Join our free discord for updates : discord.com/invite/FuW63RKgdc
All scripts & content provided by BigBeluga are for informational & educational purposes only.
🔵Join our free discord for updates : discord.com/invite/FuW63RKgdc
All scripts & content provided by BigBeluga are for informational & educational purposes only.
면책사항
해당 정보와 게시물은 금융, 투자, 트레이딩 또는 기타 유형의 조언이나 권장 사항으로 간주되지 않으며, 트레이딩뷰에서 제공하거나 보증하는 것이 아닙니다. 자세한 내용은 이용 약관을 참조하세요.
오픈 소스 스크립트
트레이딩뷰의 진정한 정신에 따라, 이 스크립트의 작성자는 이를 오픈소스로 공개하여 트레이더들이 기능을 검토하고 검증할 수 있도록 했습니다. 작성자에게 찬사를 보냅니다! 이 코드는 무료로 사용할 수 있지만, 코드를 재게시하는 경우 하우스 룰이 적용된다는 점을 기억하세요.
🔵Gain access to our powerful tools : bigbeluga.com/tv
🔵Join our free discord for updates : discord.com/invite/FuW63RKgdc
All scripts & content provided by BigBeluga are for informational & educational purposes only.
🔵Join our free discord for updates : discord.com/invite/FuW63RKgdc
All scripts & content provided by BigBeluga are for informational & educational purposes only.
면책사항
해당 정보와 게시물은 금융, 투자, 트레이딩 또는 기타 유형의 조언이나 권장 사항으로 간주되지 않으며, 트레이딩뷰에서 제공하거나 보증하는 것이 아닙니다. 자세한 내용은 이용 약관을 참조하세요.