Bressert Cycle Signals
█ OVERVIEW
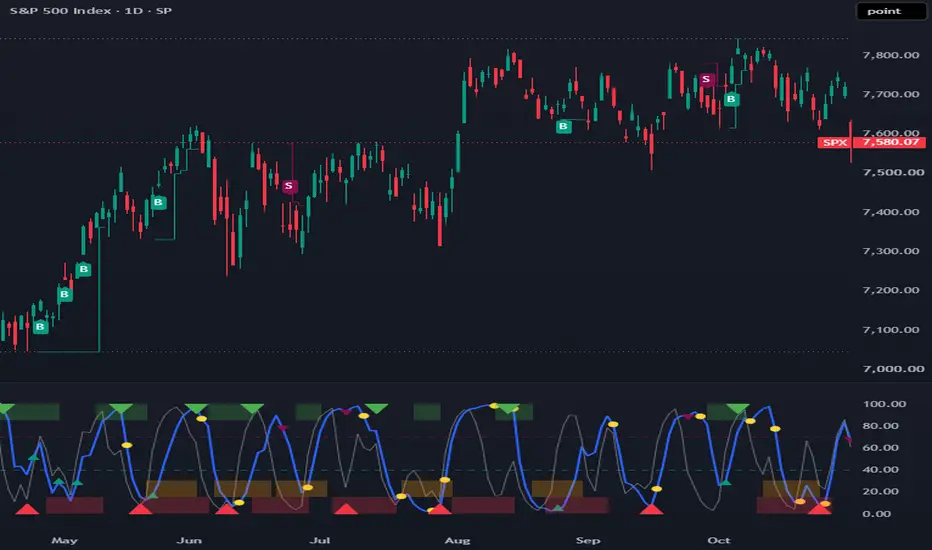
Bressert Cycle Signals plots a reconstruction of Walter Bressert's Double Stochastic oscillator, or his RSI3M3, in a separate pane. In that pane it marks his mechanical setup bars, cycle troughs and crests found from price alone, and walk-forward timing bands for the next cycle turn. Buy and sell triggers and the protective stop of the current signal are drawn on the price chart.
The method's thesis is that a trading-cycle turn should be traded when three things line up: the time since the last turn says a new one is due, an oscillator turns from an extreme, and the next longer cycle points the same way, with entry deferred until price trades through the turning bar.
█ HISTORY / BACKGROUND
Walter J. Bressert was a cycle analyst who built on the cycle work of J.M. Hurst and Edward Dewey. He published a cycle advisory newsletter from 1974 to 1985 and set out his approach in The Power of Oscillator/Cycle Combinations (1991), The Cycle Trading Pattern Manual (1997) and Trading With Time Fractals (1998). He later sold charting software built on the same rules.
Bressert treated markets as sets of nested cycles. He wrote that most trading cycles run 18 to 22 bars and average about 20, and his software handled trading cycles of 14 to 27 bars. Each trading cycle splits into two half cycles. The next longer cycle sets the trend. When it rises, trading-cycle crests come late and lows step higher. When it falls, crests come early and lows step lower.
He measured past trough-to-trough, trough-to-crest and crest-to-trough intervals and kept the central share of them as timing bands, the windows in which the next turn is most likely. His 1991 book keeps the middle 70% of the measured cycles. His later software used 40% bands, with 30% of turns arriving before the band and 30% after it.
Inside a band, the oscillator times the turn. For a buy, the oscillator drops below its buy line and turns up. The bar that turns it up is the setup bar. A buy stop one tick above that bar's high is the entry, and the protective stop goes one tick below the cycle low. Sells mirror this. His software defaults were a Double Stochastic length of 10, about half the trading cycle, a buy line of 40, a sell line of 70 and a 4-bar window for the entry. He took signals in the direction of the next longer cycle or at trend reversals, and read the weekly Double Stochastic's direction as the trend for daily charts. Near an oscillator extreme he trailed a 2-bar reversal stop.
Bressert never published the Double Stochastic's arithmetic. He described it only as "a stochastic of a stochastic, with another twist or two," so the version in this script is a reconstruction. RSI3M3 is fully published: a 3-period RSI smoothed by a 3-bar moving average, with a buy line of 30.
█ HOW IT WORKS
Oscillator
1. The Double Stochastic first computes a ratio of 100 × (close - lowest low) / (highest high - lowest low) over n bars. When that range is zero, the previous ratio is kept.
2. The ratio is smoothed recursively: each new value moves halfway from the previous smoothed value toward the new ratio. The first ratio seeds the series.
3. The same ratio is then taken of the smoothed line against its own n-bar highest and lowest values and smoothed the same way. The result is the oscillator, defined from bar 2 × (n - 1) onward.
4. RSI3M3 is a 3-period RSI smoothed by a 3-bar simple moving average.
5. The second Double Stochastic uses the same construction with its own length and is for display only.
Setup bars
6. The script tracks the oscillator's current decline. A decline starts on the first falling bar after a setup, or after any rise larger than the turn threshold that produced no setup. Smaller rises leave the decline running from its lowest value.
7. A buy setup occurs on a rising bar when the decline's lowest value is below the buy line and the rise from that value exceeds the turn threshold. Sell setups mirror this with rallies above the sell line.
Trend filter
8. The trend state is requested from the higher time frame with request.security, using the state of the last completed higher-time-frame bar (a one-bar offset with lookahead on). It does not use future data and does not change while a higher-time-frame bar is forming.
9. In oscillator-direction mode the state is +1 when the higher-time-frame oscillator rose on that bar and -1 when it fell. In EMA-pair mode it is +1 when the fast EMA is above the slow EMA and rising, -1 when below and falling, and 0 otherwise. In EMA %Diff mode it is +1 when 100 × (fast - slow) / slow rose and -1 when it fell. The EMAs are seeded with the first close.
10. Buy setups are allowed when the state is 0 or +1 and sell setups when it is 0 or -1. With the filter set to None, every setup is allowed.
11. The optional band filter also requires a buy setup to fall inside the T-T or C-T band, or on or after the start of either, depending on the setting. Sell setups use the T-C band. While the band filter is on and no band is in force, setups are blocked.
Triggers
12. An allowed buy setup places a pending buy stop at the setup bar's high plus the trigger offset in ticks. It stays valid on the next bars up to the trigger window, and a newer allowed buy setup replaces it. The trigger fills when a later bar's high reaches the stop. Sell triggers mirror this at the setup bar's low.
Stops
13. The script tracks one hypothetical position to place the stop line. A buy trigger opens a long position unless one is already open, reversing a short. A sell trigger does the opposite. When both triggers fill on the same bar, no position is opened.
14. The initial long stop is one tick below the lowest low from the bar before the oscillator's decline began through the trigger bar. The initial short stop mirrors this above the highest high of the rally.
15. The stop is not tested on the entry bar. A long position ends when a later bar's low reaches the stop, and a short when a later bar's high reaches it.
16. In "At oscillator extreme" mode, once the oscillator reaches the sell line during a long, or the buy line during a short, the stop moves at each close to one tick beyond the lowest low, or highest high, of the last N bars whenever that is tighter. "Always" applies this from entry, and "Off" keeps the initial stop.
Cycles and timing bands
17. A trough is a bar whose low is below each of the next k lows and no higher than each of the k lows before it, where k is the trough and crest strength. It is confirmed k bars later.
18. A new trough closer to the current trough than the shortest cycle replaces it if its low is lower, and is ignored otherwise.
19. When a new trough is accepted, the crest of the completed cycle is the highest high strictly between the two troughs, with the earliest bar taken on ties. The completed cycle adds its trough-to-trough, trough-to-crest and crest-to-trough intervals to the history when its trough-to-trough length lies between the shortest cycle and the longest interval kept. Only the most recent cycles are kept. If the latest trough is later replaced, its cycle is recomputed.
20. From the latest trough, the T-T and T-C bands run from the trough bar plus the lower percentile to the trough bar plus the upper percentile of their histories, using the nearest-rank method. The percentiles are 30 and 70 for the 40% width, and 15 and 85 for the 70% width. Bands are drawn once the history holds the required number of cycles.
21. After a trough, the highest confirmed pivot high of the same strength is the interim crest. The C-T band is projected from it with the crest-to-trough history and is redrawn if a higher pivot high is confirmed before the next trough.
22. With trend-adjusted halves on, an uptrend runs the T-C band from the rounded average of its history to its upper bound and the C-T band from its lower bound to the average. A downtrend reverses this. The average is clamped inside the band.
23. The generic 20-bar source replaces the history with fixed bands from each trough: T-C from 8 to 14 bars and T-T from 15 to 22 bars. It draws no C-T band.
24. When the next trough is accepted, the cycle is scored. The script records whether the trough fell before, inside or after the T-T band forecast from the trough before it, whether the crest fell before, inside or after that cycle's T-C band, and whether the trough fell before, inside or after the C-T band in force on the trough bar. Cycles without a forecast are not scored.
█ HOW TO USE
The script is designed for daily charts. The defaults are bar counts set for Bressert's daily trading cycle, with an oscillator length of about half a 20-bar cycle, and the automatic higher time frame maps a daily chart to weekly, the pairing he used. On other charts the automatic mapping is weekly to monthly, monthly to quarterly, and intraday to four times the chart interval. Bressert applied the same bar counts to intraday charts, but the cycle and band settings should match the cycle length visible on the chart in use.
Read the output in this order:
1. The bands give the time context. The red strip is where the next trough is due counted from the last trough, the orange strip is the same window counted from the last crest, and the green strip is where the next crest is due.
2. A setup triangle marks a candidate turn. It is not an entry.
3. A B or S on the price chart is the entry. It prints when price trades through the setup bar within the trigger window.
4. The step line on the price chart is where the method's stop sits for that position. The line ends when price reaches it.
In the oscillator pane
• The blue line is the signal oscillator, and the gray line is the second Double Stochastic.
• The teal dashed line is the buy line and the maroon dashed line is the sell line.
• A teal up-triangle on the blue line is an allowed buy setup. A maroon down-triangle is an allowed sell setup.
• A dot on the blue line, yellow by default, is a setup that the trend filter or band filter blocked.
• A red up-triangle along the bottom edge is a confirmed trough. It appears k bars after the trough, is placed on the trough bar, and moves if a lower low replaces it.
• A green down-triangle along the top edge is the crest of a completed cycle. It is drawn when the next trough is accepted.
• The red box from 0 to 15 is the T-T band, the orange box from 15 to 30 is the C-T band, and the green box from 85 to 100 is the T-C band. A trough marker that lands inside the red box arrived within its forecast window.
• The optional table, top right, shows for each band type the share of scored cycles that turned before, inside and after the band, with the count and the band's nominal split.
On the price chart
• A teal B below a bar is a buy trigger and a maroon S above a bar is a sell trigger. A B or S prints whenever a pending stop fills, including while a position on the same side is already open, in which case the stop is unchanged.
• The teal step line is the stop of the open long position and the maroon step line is the stop of the open short.
Data window and alerts
Values prefixed d_ appear only in the data window: setup and allowed-setup flags, trigger flags, the trend state, the trough flag (1 accepted, 2 replaced), band bounds as bar indices, the position state, the stop and the bar index. Alert conditions are provided for Buy setup, Sell setup, Buy trigger, Sell trigger and Trough confirmed.
█ SETTINGS
Oscillator
• Signal oscillator selects the line that drives setups and the higher-time-frame oscillator, Double Stochastic or RSI3M3. Default Double Stochastic.
• Double Stochastic length sets n for the signal Double Stochastic and its higher-time-frame copy. Default 10.
• Show second Double Stochastic and its length draw a display-only Double Stochastic. Default on, 5.
• Double Stochastic buy line and sell line set the levels a decline must pass below, or a rally above, for a setup. Default 40 and 70.
• RSI3M3 buy line and sell line do the same when RSI3M3 is selected. Default 30 and 70.
Setup and trigger
• Turn threshold is how far the oscillator must turn from its low or high to mark a setup bar. Default 0, which accepts any turn.
• Trigger window (bars) is the number of bars after the setup bar on which the trigger can fill. Default 4.
• Trigger offset (ticks) places the buy stop above the setup bar's high, or the sell stop below its low, by this many ticks. Default 1.
Trend filter
• Trend filter chooses None, HTF oscillator direction, HTF EMA pair or HTF EMA %Diff. Default HTF oscillator direction.
• Automatic higher time frame maps the chart to its higher time frame as described above. Default on.
• Manual higher time frame is used when the automatic option is off. Default 1 week.
• HTF EMA fast and slow are the EMA lengths for the two EMA modes. Bressert did not publish his lengths. Default 10 and 20.
Timing bands
• Trading cycle, shortest (bars) is the minimum spacing between troughs and the shortest cycle admitted to the band history. Default 14.
• Trough and crest strength is k, the number of bars on each side of a pivot. Default 4.
• Longest interval kept is the longest trough-to-trough interval admitted to the band history. Default 54.
• Band width chooses 40% (later definition), the 30th to 70th percentiles, or 70% (1991 definition), the 15th to 85th. Default 40%.
• Band source chooses walk-forward history or the generic 20-bar bands. Default walk-forward history.
• Cycles in history is how many recent completed cycles the bands use. Default 20.
• Cycles needed before drawing is the minimum history before bands appear. Default 6.
• Trend-adjusted T-C and C-T halves applies the 1991 half-band rule. Default off.
• Signal band filter chooses Off, Inside a band or On or after band start. Default Off.
Stops
• Trailing stop chooses At oscillator extreme, Always or Off. Default At oscillator extreme.
• Trailing stop bars is N for the trailing stop. Default 2. Bressert published only the 2-bar default, so the price rule used here is an interpretation.
Display
• Show filtered-out setups and its color control the blocked-setup dots. Default on, yellow.
• Show timing bands. Default on.
• Show band calibration table. Default off.
• Show troughs and crests. Default on.
█ WHAT MAKES IT ORIGINAL
The script implements Bressert's whole published signal sequence rather than an oscillator alone: decline tracking with his turn threshold, the setup bar, a stop entry valid for his 4-bar window, the protective stop beyond the cycle low, and a trailing stop that engages at the oscillator extreme, each at his published default. The Double Stochastic follows his published length and 40 and 70 lines, uses a recursive half-step smoothing, and is labeled a reconstruction because his formula was never disclosed.
Cycle troughs are found from price alone, with a minimum spacing, and not from the oscillator. Bressert picked lows partly by reading his oscillators. Keeping the two apart stops the oscillator from labeling the turns it is then judged against.
The timing bands are walk-forward. Each forecast uses only cycles completed before it was made, with either of Bressert's two published band widths and his 1991 trend-adjusted halves. The calibration table scores every forecast against the cycle that followed, so a reader can see how the bands behave on the chart in use instead of assuming it.
The higher-time-frame trend is read from completed bars only and offers the three trend methods Bressert described: the longer oscillator's direction, an EMA pair and the EMA percentage difference. The parts are one method rather than a combination of unrelated tools. The trend filter and the bands decide which setups place stops, and each stop is anchored to the decline that produced its setup.
█ NOTES / LIMITATIONS
• The Double Stochastic is a reconstruction. Its values can differ from Bressert's own software.
• History: the oscillator starts at bar 2 × (n - 1). The trend state is neutral, allowing both sides, until the higher time frame has enough completed bars for its own oscillator. Bands appear only after the history holds the required number of completed cycles, so short histories show no bands.
• All lengths, intervals and bands count chart bars, not calendar days, and the defaults assume a daily chart.
• Higher-time-frame values come from the last completed higher-time-frame bar and do not repaint. Setups, blocked-setup dots, the trough flag and their alerts are evaluated on the forming bar and can appear or disappear before it closes. Use alerts set to once per bar close for these. A trigger that prints on the forming bar stays, because that bar's high or low cannot retreat.
• Troughs are confirmed k bars late and drawn back on the trough bar. A trough marker can move when a lower low replaces it, crest markers are drawn when the next trough is accepted, and bands are redrawn when their trough is replaced.
• Because the bands are percentiles of past intervals, a hit rate near the nominal split is expected by construction when interval lengths are stable. A matching rate does not by itself show cyclic structure.
• The position used for the stop line is hypothetical. The script reports no results and models no fills, gaps or position size. Stops are tested against bar highs and lows, triggers on the same bar in both directions are ignored, and the stop is not tested on the entry bar. A setup blocked by a filter places no stop, so it does not close an open position on the other side.
• Compute limits: max bars back is 2000. The crest search, the stop anchor and the C-T band lookup reference history up to that depth, and their loops run over the bars between troughs or since the decline began. Boxes and labels are capped at 500 each, so the oldest bands and cycle markers are removed on long histories.
• The script uses open, high, low and close and the symbol's minimum tick, so it runs on any symbol class. Volume is not used.
Bressert Cycle Signals plots a reconstruction of Walter Bressert's Double Stochastic oscillator, or his RSI3M3, in a separate pane. In that pane it marks his mechanical setup bars, cycle troughs and crests found from price alone, and walk-forward timing bands for the next cycle turn. Buy and sell triggers and the protective stop of the current signal are drawn on the price chart.
The method's thesis is that a trading-cycle turn should be traded when three things line up: the time since the last turn says a new one is due, an oscillator turns from an extreme, and the next longer cycle points the same way, with entry deferred until price trades through the turning bar.
█ HISTORY / BACKGROUND
Walter J. Bressert was a cycle analyst who built on the cycle work of J.M. Hurst and Edward Dewey. He published a cycle advisory newsletter from 1974 to 1985 and set out his approach in The Power of Oscillator/Cycle Combinations (1991), The Cycle Trading Pattern Manual (1997) and Trading With Time Fractals (1998). He later sold charting software built on the same rules.
Bressert treated markets as sets of nested cycles. He wrote that most trading cycles run 18 to 22 bars and average about 20, and his software handled trading cycles of 14 to 27 bars. Each trading cycle splits into two half cycles. The next longer cycle sets the trend. When it rises, trading-cycle crests come late and lows step higher. When it falls, crests come early and lows step lower.
He measured past trough-to-trough, trough-to-crest and crest-to-trough intervals and kept the central share of them as timing bands, the windows in which the next turn is most likely. His 1991 book keeps the middle 70% of the measured cycles. His later software used 40% bands, with 30% of turns arriving before the band and 30% after it.
Inside a band, the oscillator times the turn. For a buy, the oscillator drops below its buy line and turns up. The bar that turns it up is the setup bar. A buy stop one tick above that bar's high is the entry, and the protective stop goes one tick below the cycle low. Sells mirror this. His software defaults were a Double Stochastic length of 10, about half the trading cycle, a buy line of 40, a sell line of 70 and a 4-bar window for the entry. He took signals in the direction of the next longer cycle or at trend reversals, and read the weekly Double Stochastic's direction as the trend for daily charts. Near an oscillator extreme he trailed a 2-bar reversal stop.
Bressert never published the Double Stochastic's arithmetic. He described it only as "a stochastic of a stochastic, with another twist or two," so the version in this script is a reconstruction. RSI3M3 is fully published: a 3-period RSI smoothed by a 3-bar moving average, with a buy line of 30.
█ HOW IT WORKS
Oscillator
1. The Double Stochastic first computes a ratio of 100 × (close - lowest low) / (highest high - lowest low) over n bars. When that range is zero, the previous ratio is kept.
2. The ratio is smoothed recursively: each new value moves halfway from the previous smoothed value toward the new ratio. The first ratio seeds the series.
3. The same ratio is then taken of the smoothed line against its own n-bar highest and lowest values and smoothed the same way. The result is the oscillator, defined from bar 2 × (n - 1) onward.
4. RSI3M3 is a 3-period RSI smoothed by a 3-bar simple moving average.
5. The second Double Stochastic uses the same construction with its own length and is for display only.
Setup bars
6. The script tracks the oscillator's current decline. A decline starts on the first falling bar after a setup, or after any rise larger than the turn threshold that produced no setup. Smaller rises leave the decline running from its lowest value.
7. A buy setup occurs on a rising bar when the decline's lowest value is below the buy line and the rise from that value exceeds the turn threshold. Sell setups mirror this with rallies above the sell line.
Trend filter
8. The trend state is requested from the higher time frame with request.security, using the state of the last completed higher-time-frame bar (a one-bar offset with lookahead on). It does not use future data and does not change while a higher-time-frame bar is forming.
9. In oscillator-direction mode the state is +1 when the higher-time-frame oscillator rose on that bar and -1 when it fell. In EMA-pair mode it is +1 when the fast EMA is above the slow EMA and rising, -1 when below and falling, and 0 otherwise. In EMA %Diff mode it is +1 when 100 × (fast - slow) / slow rose and -1 when it fell. The EMAs are seeded with the first close.
10. Buy setups are allowed when the state is 0 or +1 and sell setups when it is 0 or -1. With the filter set to None, every setup is allowed.
11. The optional band filter also requires a buy setup to fall inside the T-T or C-T band, or on or after the start of either, depending on the setting. Sell setups use the T-C band. While the band filter is on and no band is in force, setups are blocked.
Triggers
12. An allowed buy setup places a pending buy stop at the setup bar's high plus the trigger offset in ticks. It stays valid on the next bars up to the trigger window, and a newer allowed buy setup replaces it. The trigger fills when a later bar's high reaches the stop. Sell triggers mirror this at the setup bar's low.
Stops
13. The script tracks one hypothetical position to place the stop line. A buy trigger opens a long position unless one is already open, reversing a short. A sell trigger does the opposite. When both triggers fill on the same bar, no position is opened.
14. The initial long stop is one tick below the lowest low from the bar before the oscillator's decline began through the trigger bar. The initial short stop mirrors this above the highest high of the rally.
15. The stop is not tested on the entry bar. A long position ends when a later bar's low reaches the stop, and a short when a later bar's high reaches it.
16. In "At oscillator extreme" mode, once the oscillator reaches the sell line during a long, or the buy line during a short, the stop moves at each close to one tick beyond the lowest low, or highest high, of the last N bars whenever that is tighter. "Always" applies this from entry, and "Off" keeps the initial stop.
Cycles and timing bands
17. A trough is a bar whose low is below each of the next k lows and no higher than each of the k lows before it, where k is the trough and crest strength. It is confirmed k bars later.
18. A new trough closer to the current trough than the shortest cycle replaces it if its low is lower, and is ignored otherwise.
19. When a new trough is accepted, the crest of the completed cycle is the highest high strictly between the two troughs, with the earliest bar taken on ties. The completed cycle adds its trough-to-trough, trough-to-crest and crest-to-trough intervals to the history when its trough-to-trough length lies between the shortest cycle and the longest interval kept. Only the most recent cycles are kept. If the latest trough is later replaced, its cycle is recomputed.
20. From the latest trough, the T-T and T-C bands run from the trough bar plus the lower percentile to the trough bar plus the upper percentile of their histories, using the nearest-rank method. The percentiles are 30 and 70 for the 40% width, and 15 and 85 for the 70% width. Bands are drawn once the history holds the required number of cycles.
21. After a trough, the highest confirmed pivot high of the same strength is the interim crest. The C-T band is projected from it with the crest-to-trough history and is redrawn if a higher pivot high is confirmed before the next trough.
22. With trend-adjusted halves on, an uptrend runs the T-C band from the rounded average of its history to its upper bound and the C-T band from its lower bound to the average. A downtrend reverses this. The average is clamped inside the band.
23. The generic 20-bar source replaces the history with fixed bands from each trough: T-C from 8 to 14 bars and T-T from 15 to 22 bars. It draws no C-T band.
24. When the next trough is accepted, the cycle is scored. The script records whether the trough fell before, inside or after the T-T band forecast from the trough before it, whether the crest fell before, inside or after that cycle's T-C band, and whether the trough fell before, inside or after the C-T band in force on the trough bar. Cycles without a forecast are not scored.
█ HOW TO USE
The script is designed for daily charts. The defaults are bar counts set for Bressert's daily trading cycle, with an oscillator length of about half a 20-bar cycle, and the automatic higher time frame maps a daily chart to weekly, the pairing he used. On other charts the automatic mapping is weekly to monthly, monthly to quarterly, and intraday to four times the chart interval. Bressert applied the same bar counts to intraday charts, but the cycle and band settings should match the cycle length visible on the chart in use.
Read the output in this order:
1. The bands give the time context. The red strip is where the next trough is due counted from the last trough, the orange strip is the same window counted from the last crest, and the green strip is where the next crest is due.
2. A setup triangle marks a candidate turn. It is not an entry.
3. A B or S on the price chart is the entry. It prints when price trades through the setup bar within the trigger window.
4. The step line on the price chart is where the method's stop sits for that position. The line ends when price reaches it.
In the oscillator pane
• The blue line is the signal oscillator, and the gray line is the second Double Stochastic.
• The teal dashed line is the buy line and the maroon dashed line is the sell line.
• A teal up-triangle on the blue line is an allowed buy setup. A maroon down-triangle is an allowed sell setup.
• A dot on the blue line, yellow by default, is a setup that the trend filter or band filter blocked.
• A red up-triangle along the bottom edge is a confirmed trough. It appears k bars after the trough, is placed on the trough bar, and moves if a lower low replaces it.
• A green down-triangle along the top edge is the crest of a completed cycle. It is drawn when the next trough is accepted.
• The red box from 0 to 15 is the T-T band, the orange box from 15 to 30 is the C-T band, and the green box from 85 to 100 is the T-C band. A trough marker that lands inside the red box arrived within its forecast window.
• The optional table, top right, shows for each band type the share of scored cycles that turned before, inside and after the band, with the count and the band's nominal split.
On the price chart
• A teal B below a bar is a buy trigger and a maroon S above a bar is a sell trigger. A B or S prints whenever a pending stop fills, including while a position on the same side is already open, in which case the stop is unchanged.
• The teal step line is the stop of the open long position and the maroon step line is the stop of the open short.
Data window and alerts
Values prefixed d_ appear only in the data window: setup and allowed-setup flags, trigger flags, the trend state, the trough flag (1 accepted, 2 replaced), band bounds as bar indices, the position state, the stop and the bar index. Alert conditions are provided for Buy setup, Sell setup, Buy trigger, Sell trigger and Trough confirmed.
█ SETTINGS
Oscillator
• Signal oscillator selects the line that drives setups and the higher-time-frame oscillator, Double Stochastic or RSI3M3. Default Double Stochastic.
• Double Stochastic length sets n for the signal Double Stochastic and its higher-time-frame copy. Default 10.
• Show second Double Stochastic and its length draw a display-only Double Stochastic. Default on, 5.
• Double Stochastic buy line and sell line set the levels a decline must pass below, or a rally above, for a setup. Default 40 and 70.
• RSI3M3 buy line and sell line do the same when RSI3M3 is selected. Default 30 and 70.
Setup and trigger
• Turn threshold is how far the oscillator must turn from its low or high to mark a setup bar. Default 0, which accepts any turn.
• Trigger window (bars) is the number of bars after the setup bar on which the trigger can fill. Default 4.
• Trigger offset (ticks) places the buy stop above the setup bar's high, or the sell stop below its low, by this many ticks. Default 1.
Trend filter
• Trend filter chooses None, HTF oscillator direction, HTF EMA pair or HTF EMA %Diff. Default HTF oscillator direction.
• Automatic higher time frame maps the chart to its higher time frame as described above. Default on.
• Manual higher time frame is used when the automatic option is off. Default 1 week.
• HTF EMA fast and slow are the EMA lengths for the two EMA modes. Bressert did not publish his lengths. Default 10 and 20.
Timing bands
• Trading cycle, shortest (bars) is the minimum spacing between troughs and the shortest cycle admitted to the band history. Default 14.
• Trough and crest strength is k, the number of bars on each side of a pivot. Default 4.
• Longest interval kept is the longest trough-to-trough interval admitted to the band history. Default 54.
• Band width chooses 40% (later definition), the 30th to 70th percentiles, or 70% (1991 definition), the 15th to 85th. Default 40%.
• Band source chooses walk-forward history or the generic 20-bar bands. Default walk-forward history.
• Cycles in history is how many recent completed cycles the bands use. Default 20.
• Cycles needed before drawing is the minimum history before bands appear. Default 6.
• Trend-adjusted T-C and C-T halves applies the 1991 half-band rule. Default off.
• Signal band filter chooses Off, Inside a band or On or after band start. Default Off.
Stops
• Trailing stop chooses At oscillator extreme, Always or Off. Default At oscillator extreme.
• Trailing stop bars is N for the trailing stop. Default 2. Bressert published only the 2-bar default, so the price rule used here is an interpretation.
Display
• Show filtered-out setups and its color control the blocked-setup dots. Default on, yellow.
• Show timing bands. Default on.
• Show band calibration table. Default off.
• Show troughs and crests. Default on.
█ WHAT MAKES IT ORIGINAL
The script implements Bressert's whole published signal sequence rather than an oscillator alone: decline tracking with his turn threshold, the setup bar, a stop entry valid for his 4-bar window, the protective stop beyond the cycle low, and a trailing stop that engages at the oscillator extreme, each at his published default. The Double Stochastic follows his published length and 40 and 70 lines, uses a recursive half-step smoothing, and is labeled a reconstruction because his formula was never disclosed.
Cycle troughs are found from price alone, with a minimum spacing, and not from the oscillator. Bressert picked lows partly by reading his oscillators. Keeping the two apart stops the oscillator from labeling the turns it is then judged against.
The timing bands are walk-forward. Each forecast uses only cycles completed before it was made, with either of Bressert's two published band widths and his 1991 trend-adjusted halves. The calibration table scores every forecast against the cycle that followed, so a reader can see how the bands behave on the chart in use instead of assuming it.
The higher-time-frame trend is read from completed bars only and offers the three trend methods Bressert described: the longer oscillator's direction, an EMA pair and the EMA percentage difference. The parts are one method rather than a combination of unrelated tools. The trend filter and the bands decide which setups place stops, and each stop is anchored to the decline that produced its setup.
█ NOTES / LIMITATIONS
• The Double Stochastic is a reconstruction. Its values can differ from Bressert's own software.
• History: the oscillator starts at bar 2 × (n - 1). The trend state is neutral, allowing both sides, until the higher time frame has enough completed bars for its own oscillator. Bands appear only after the history holds the required number of completed cycles, so short histories show no bands.
• All lengths, intervals and bands count chart bars, not calendar days, and the defaults assume a daily chart.
• Higher-time-frame values come from the last completed higher-time-frame bar and do not repaint. Setups, blocked-setup dots, the trough flag and their alerts are evaluated on the forming bar and can appear or disappear before it closes. Use alerts set to once per bar close for these. A trigger that prints on the forming bar stays, because that bar's high or low cannot retreat.
• Troughs are confirmed k bars late and drawn back on the trough bar. A trough marker can move when a lower low replaces it, crest markers are drawn when the next trough is accepted, and bands are redrawn when their trough is replaced.
• Because the bands are percentiles of past intervals, a hit rate near the nominal split is expected by construction when interval lengths are stable. A matching rate does not by itself show cyclic structure.
• The position used for the stop line is hypothetical. The script reports no results and models no fills, gaps or position size. Stops are tested against bar highs and lows, triggers on the same bar in both directions are ignored, and the stop is not tested on the entry bar. A setup blocked by a filter places no stop, so it does not close an open position on the other side.
• Compute limits: max bars back is 2000. The crest search, the stop anchor and the C-T band lookup reference history up to that depth, and their loops run over the bars between troughs or since the decline began. Boxes and labels are capped at 500 each, so the oldest bands and cycle markers are removed on long histories.
• The script uses open, high, low and close and the symbol's minimum tick, so it runs on any symbol class. Volume is not used.

면책사항
해당 정보와 게시물은 금융, 투자, 트레이딩 또는 기타 유형의 조언이나 권장 사항으로 간주되지 않으며, 트레이딩뷰에서 제공하거나 보증하는 것이 아닙니다. 자세한 내용은 이용 약관을 참조하세요.
면책사항
해당 정보와 게시물은 금융, 투자, 트레이딩 또는 기타 유형의 조언이나 권장 사항으로 간주되지 않으며, 트레이딩뷰에서 제공하거나 보증하는 것이 아닙니다. 자세한 내용은 이용 약관을 참조하세요.