OPEN-SOURCE SCRIPT
NSE F&O Option Scanner
How the Scoring Works (0–5 points)
Each condition adds 1 point:
✅ 8 EMA above 20 EMA (trend direction)
✅ OI Proxy confirms direction (Volume + Price interpretation)
✅ Sector index trading above its 20 EMA
✅ RSI not in extreme zone (not overbought for CE / not oversold for PE)
✅ Volume spike ≥ 1.5× the 20-bar average
Score ≥ 4 → High conviction signal → BUY CE or BUY PE label appears on chart
Score 3 → Weak setup — wait for confirmation
Score < 3 → No trade
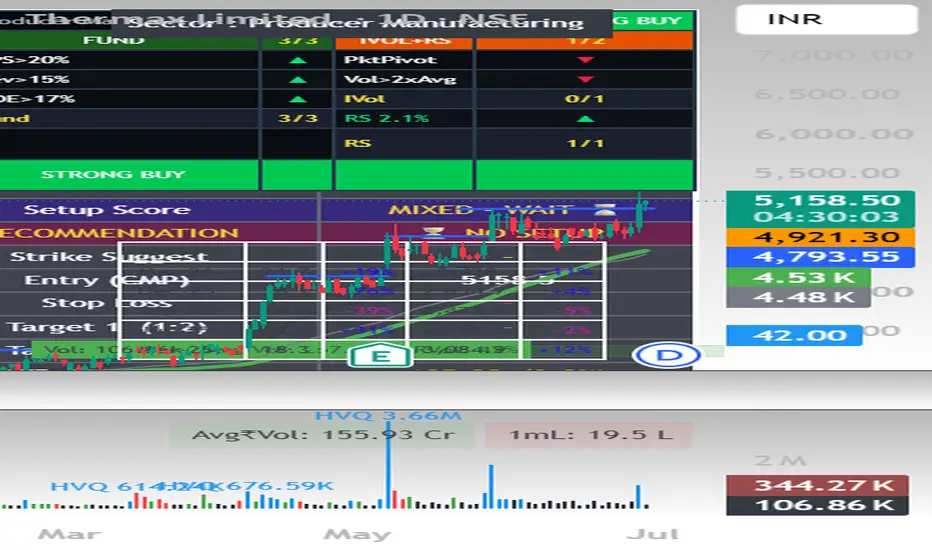
Dashboard Shows (top-right panel)
🔹 8/20 EMA trend + gap %
🔹 OI Proxy: Long Buildup / Short Buildup / Short Covering / Long Unwinding
🔹 Sector trend vs 20 EMA
🔹 Relative Strength vs sector (20-bar)
🔹 RSI (14) with overbought/oversold alert
🔹 MACD Histogram direction
🔹 Volume — Normal or Spike with multiplier
🔹 Setup Score (0–5)
🔹 Recommendation — 🟢 BUY CALL (CE) / 🔴 BUY PUT (PE) / ⏳ NO SETUP
🔹 Auto Strike Suggestion — ATM + 1 OTM (calculated from CMP)
🔹 Entry (CMP), Stop Loss, Target 1 (1:2), Target 2 (1:3)
🔹 ATR with volatility %
🔹 News reminder
How to Use
Add to any NSE F&O stock on Daily or 1H timeframe
Change the Sector Index input to match the stock — NIFTY_BANK, NIFTY_IT, NIFTY_AUTO, NIFTY_PHARMA, NIFTY_FMCG, NIFTY_METAL etc.
Read the dashboard — Score ≥ 4 = high conviction setup
Always verify news and catalyst on NSE website or Screener.in before entering
Set alerts using the 5 built-in alert conditions
Built-in Alerts
🟢 Strong BUY CE — EMA cross + OI + Sector all aligned (score ≥ 4)
🔴 Strong BUY PE — EMA cross + OI + Sector all aligned (score ≥ 4)
📊 EMA Bull Cross — 8 EMA crossed above 20 EMA
📊 EMA Bear Cross — 8 EMA crossed below 20 EMA
📈 Volume Spike in Bull Trend
Note on OI Data
For real open interest data, switch to the futures chart (e.g. NSE:RELIANCE1!). On equity charts this script uses Volume + Price direction as an OI proxy, which closely mirrors standard OI interpretation (Long Buildup, Short Buildup, Short Covering, Long Unwinding).
Settings
All parameters are adjustable — EMA lengths, ATR multiplier, Risk:Reward ratio, OI proxy sensitivity, and sector index. Tooltips explain each input.
⚠️ For educational and analysis purposes only. Not financial advice. Always use proper risk managemen
Each condition adds 1 point:
✅ 8 EMA above 20 EMA (trend direction)
✅ OI Proxy confirms direction (Volume + Price interpretation)
✅ Sector index trading above its 20 EMA
✅ RSI not in extreme zone (not overbought for CE / not oversold for PE)
✅ Volume spike ≥ 1.5× the 20-bar average
Score ≥ 4 → High conviction signal → BUY CE or BUY PE label appears on chart
Score 3 → Weak setup — wait for confirmation
Score < 3 → No trade
Dashboard Shows (top-right panel)
🔹 8/20 EMA trend + gap %
🔹 OI Proxy: Long Buildup / Short Buildup / Short Covering / Long Unwinding
🔹 Sector trend vs 20 EMA
🔹 Relative Strength vs sector (20-bar)
🔹 RSI (14) with overbought/oversold alert
🔹 MACD Histogram direction
🔹 Volume — Normal or Spike with multiplier
🔹 Setup Score (0–5)
🔹 Recommendation — 🟢 BUY CALL (CE) / 🔴 BUY PUT (PE) / ⏳ NO SETUP
🔹 Auto Strike Suggestion — ATM + 1 OTM (calculated from CMP)
🔹 Entry (CMP), Stop Loss, Target 1 (1:2), Target 2 (1:3)
🔹 ATR with volatility %
🔹 News reminder
How to Use
Add to any NSE F&O stock on Daily or 1H timeframe
Change the Sector Index input to match the stock — NIFTY_BANK, NIFTY_IT, NIFTY_AUTO, NIFTY_PHARMA, NIFTY_FMCG, NIFTY_METAL etc.
Read the dashboard — Score ≥ 4 = high conviction setup
Always verify news and catalyst on NSE website or Screener.in before entering
Set alerts using the 5 built-in alert conditions
Built-in Alerts
🟢 Strong BUY CE — EMA cross + OI + Sector all aligned (score ≥ 4)
🔴 Strong BUY PE — EMA cross + OI + Sector all aligned (score ≥ 4)
📊 EMA Bull Cross — 8 EMA crossed above 20 EMA
📊 EMA Bear Cross — 8 EMA crossed below 20 EMA
📈 Volume Spike in Bull Trend
Note on OI Data
For real open interest data, switch to the futures chart (e.g. NSE:RELIANCE1!). On equity charts this script uses Volume + Price direction as an OI proxy, which closely mirrors standard OI interpretation (Long Buildup, Short Buildup, Short Covering, Long Unwinding).
Settings
All parameters are adjustable — EMA lengths, ATR multiplier, Risk:Reward ratio, OI proxy sensitivity, and sector index. Tooltips explain each input.
⚠️ For educational and analysis purposes only. Not financial advice. Always use proper risk managemen
오픈 소스 스크립트
트레이딩뷰의 진정한 정신에 따라, 이 스크립트의 작성자는 이를 오픈소스로 공개하여 트레이더들이 기능을 검토하고 검증할 수 있도록 했습니다. 작성자에게 찬사를 보냅니다! 이 코드는 무료로 사용할 수 있지만, 코드를 재게시하는 경우 하우스 룰이 적용된다는 점을 기억하세요.

면책사항
해당 정보와 게시물은 금융, 투자, 트레이딩 또는 기타 유형의 조언이나 권장 사항으로 간주되지 않으며, 트레이딩뷰에서 제공하거나 보증하는 것이 아닙니다. 자세한 내용은 이용 약관을 참조하세요.
오픈 소스 스크립트
트레이딩뷰의 진정한 정신에 따라, 이 스크립트의 작성자는 이를 오픈소스로 공개하여 트레이더들이 기능을 검토하고 검증할 수 있도록 했습니다. 작성자에게 찬사를 보냅니다! 이 코드는 무료로 사용할 수 있지만, 코드를 재게시하는 경우 하우스 룰이 적용된다는 점을 기억하세요.
면책사항
해당 정보와 게시물은 금융, 투자, 트레이딩 또는 기타 유형의 조언이나 권장 사항으로 간주되지 않으며, 트레이딩뷰에서 제공하거나 보증하는 것이 아닙니다. 자세한 내용은 이용 약관을 참조하세요.