OPEN-SOURCE SCRIPT
Markov Regime 2.0 - Bull / Bear / Sideways
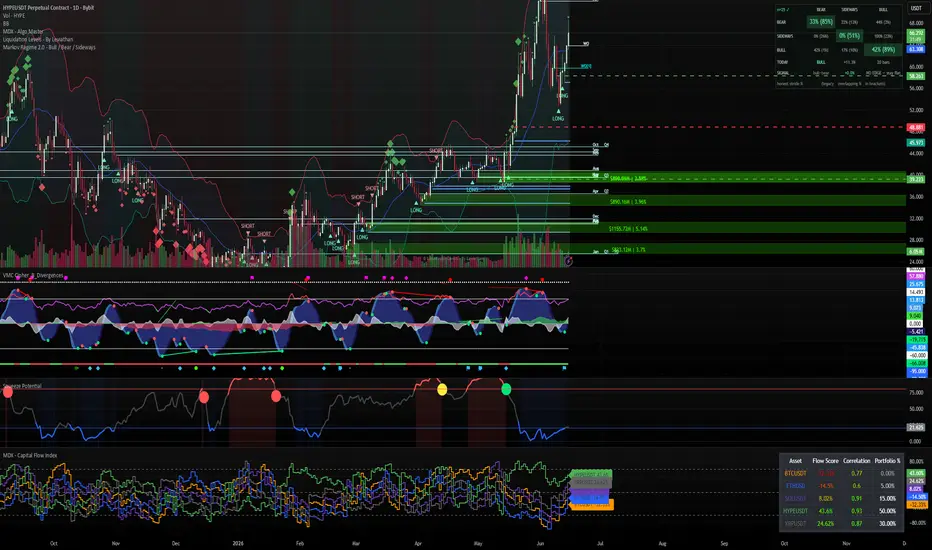
Here's a publish-ready description for the indicator — written to be honest about what it does and doesn't do (in the spirit of the method):
---
**Markov Regime 2.0 — Bull / Bear / Sideways**
A market-regime model that labels price history into Bull / Bear / Sideways states, builds the Markov transition matrix between them, and turns the regime's persistence into a directional signal. This is a corrected rebuild of the classic Markov regime indicator, with three statistical flaws fixed — so the numbers it shows are honest rather than flattering.
**How it works**
- Each bar is labelled by its rolling N-day return: ≥ +5% = Bull, ≤ −5% = Bear, otherwise Sideways (all configurable).
- It counts how often each state transitions to each other state and normalises into a 3×3 probability matrix. The diagonal is the regime "stickiness" — how likely a state is to persist.
- The signal is `P(bull next) − P(bear next)` from today's regime row: sign = direction, magnitude = conviction.
**The three corrections (what makes it 2.0)**
1. **Stride sampling (the autocorrelation fix).** The original counted a transition on *every* bar — but consecutive rolling windows share all but one bar, which manufactures fake persistence on the diagonal. 2.0 also counts transitions between *non-overlapping* windows (stride = lookback). Each matrix cell shows `honest stride % (legacy overlapping % in brackets)` so you can see the inflation directly.
2. **Label self-check.** Before displaying, it verifies that mean return of Bear < Sideways < Bull and flags a `✓`/`✗` next to the sample size — so a mislabelled state can't ship silently.
3. **Explicit signal + modes.** A real signal with a no-edge deadband (Standalone mode sizes a position by conviction; Filter mode just gates longs/shorts), instead of pure visualisation.
**On the chart**
- A compact dashboard: the transition matrix, current regime (TODAY), the live signal with a verdict (`stay flat` / `LONG x%` / `SHORT x%`), sample size and label-check.
- Optional regime ribbon and state-transition labels.
- **Edge markers:** ▲ LONG / ▼ SHORT print on the candle where the *walk-forward* signal first crosses the deadband. The per-bar signal uses only data available up to that bar (no look-ahead), so markers on closed bars don't repaint. Matching alerts are built in.
**How to read it**
Use it on a daily chart — the default is a ~20-*day* regime concept. Treat the honest (stride) column as the real one; if it sits near 33% (a 3-state coin flip) and the signal stays inside the deadband, the model is telling you there's **no edge — stay flat**, and that's a valid answer. The bracketed legacy values are shown only to expose how much the old overlapping method exaggerates persistence. Small-history assets will have a low transition count (`n=`) — the smaller that number, the less you should trust the matrix.
**Disclaimer**
This is a research and visualisation tool, not financial advice and not a strategy with a guaranteed edge. It reads regimes and reports what your own rules imply; it does not place trades. Past regime behaviour does not predict future returns. Always size and manage risk yourself.
Original framework: Roan (@RohOnChain). 2.0 corrections per the Markov 2.0 method.
---
Want a **short version** (2–3 lines for the script's one-liner subtitle), or should I drop this straight into the code as the top comment block / an `//description` line?
---
**Markov Regime 2.0 — Bull / Bear / Sideways**
A market-regime model that labels price history into Bull / Bear / Sideways states, builds the Markov transition matrix between them, and turns the regime's persistence into a directional signal. This is a corrected rebuild of the classic Markov regime indicator, with three statistical flaws fixed — so the numbers it shows are honest rather than flattering.
**How it works**
- Each bar is labelled by its rolling N-day return: ≥ +5% = Bull, ≤ −5% = Bear, otherwise Sideways (all configurable).
- It counts how often each state transitions to each other state and normalises into a 3×3 probability matrix. The diagonal is the regime "stickiness" — how likely a state is to persist.
- The signal is `P(bull next) − P(bear next)` from today's regime row: sign = direction, magnitude = conviction.
**The three corrections (what makes it 2.0)**
1. **Stride sampling (the autocorrelation fix).** The original counted a transition on *every* bar — but consecutive rolling windows share all but one bar, which manufactures fake persistence on the diagonal. 2.0 also counts transitions between *non-overlapping* windows (stride = lookback). Each matrix cell shows `honest stride % (legacy overlapping % in brackets)` so you can see the inflation directly.
2. **Label self-check.** Before displaying, it verifies that mean return of Bear < Sideways < Bull and flags a `✓`/`✗` next to the sample size — so a mislabelled state can't ship silently.
3. **Explicit signal + modes.** A real signal with a no-edge deadband (Standalone mode sizes a position by conviction; Filter mode just gates longs/shorts), instead of pure visualisation.
**On the chart**
- A compact dashboard: the transition matrix, current regime (TODAY), the live signal with a verdict (`stay flat` / `LONG x%` / `SHORT x%`), sample size and label-check.
- Optional regime ribbon and state-transition labels.
- **Edge markers:** ▲ LONG / ▼ SHORT print on the candle where the *walk-forward* signal first crosses the deadband. The per-bar signal uses only data available up to that bar (no look-ahead), so markers on closed bars don't repaint. Matching alerts are built in.
**How to read it**
Use it on a daily chart — the default is a ~20-*day* regime concept. Treat the honest (stride) column as the real one; if it sits near 33% (a 3-state coin flip) and the signal stays inside the deadband, the model is telling you there's **no edge — stay flat**, and that's a valid answer. The bracketed legacy values are shown only to expose how much the old overlapping method exaggerates persistence. Small-history assets will have a low transition count (`n=`) — the smaller that number, the less you should trust the matrix.
**Disclaimer**
This is a research and visualisation tool, not financial advice and not a strategy with a guaranteed edge. It reads regimes and reports what your own rules imply; it does not place trades. Past regime behaviour does not predict future returns. Always size and manage risk yourself.
Original framework: Roan (@RohOnChain). 2.0 corrections per the Markov 2.0 method.
---
Want a **short version** (2–3 lines for the script's one-liner subtitle), or should I drop this straight into the code as the top comment block / an `//description` line?
오픈 소스 스크립트
트레이딩뷰의 진정한 정신에 따라, 이 스크립트의 작성자는 이를 오픈소스로 공개하여 트레이더들이 기능을 검토하고 검증할 수 있도록 했습니다. 작성자에게 찬사를 보냅니다! 이 코드는 무료로 사용할 수 있지만, 코드를 재게시하는 경우 하우스 룰이 적용된다는 점을 기억하세요.

면책사항
해당 정보와 게시물은 금융, 투자, 트레이딩 또는 기타 유형의 조언이나 권장 사항으로 간주되지 않으며, 트레이딩뷰에서 제공하거나 보증하는 것이 아닙니다. 자세한 내용은 이용 약관을 참조하세요.
오픈 소스 스크립트
트레이딩뷰의 진정한 정신에 따라, 이 스크립트의 작성자는 이를 오픈소스로 공개하여 트레이더들이 기능을 검토하고 검증할 수 있도록 했습니다. 작성자에게 찬사를 보냅니다! 이 코드는 무료로 사용할 수 있지만, 코드를 재게시하는 경우 하우스 룰이 적용된다는 점을 기억하세요.
면책사항
해당 정보와 게시물은 금융, 투자, 트레이딩 또는 기타 유형의 조언이나 권장 사항으로 간주되지 않으며, 트레이딩뷰에서 제공하거나 보증하는 것이 아닙니다. 자세한 내용은 이용 약관을 참조하세요.