Orderflow Tool [OmegaTools]
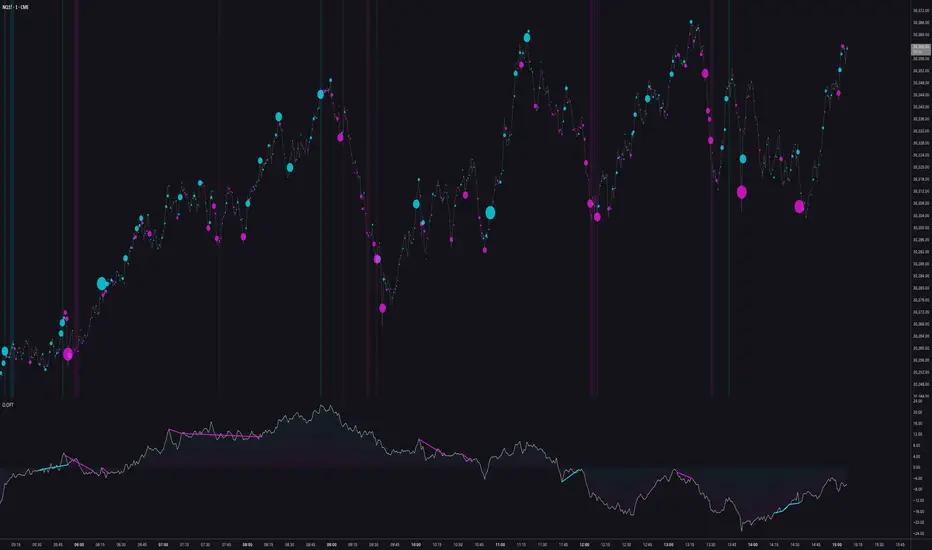
Orderflow Tool: Delta Bubbles, Extremes and Divergences Detector
Overview
The Orderflow Tool is a volume-based analytical suite that reconstructs buying and selling pressure directly from intrabar data and presents it through four complementary layers: directional volume bubbles on the chart, statistically defined extreme order-flow zones, a multi-factor cumulative delta oscillator, and an automated divergence engine. Rather than relying on a single volume metric, the tool blends raw delta, normalized volume imbalance, and price-action behavior into one coherent reading of who is in control of the market — buyers or sellers — and how committed they are.
The indicator works on any symbol that provides volume data and on any chart timeframe.
How It Works
At its core, the tool pulls lower-timeframe data through TradingView's intrabar engine to estimate volume delta — the difference between volume traded on up-closing intrabars and volume traded on down-closing intrabars. This produces a far more granular picture of net aggression than standard bar volume, without requiring tick-level feeds.
Every derived metric is statistically normalized against its own recent standard deviation. This is a deliberate design choice: by expressing delta, volume, and imbalance in standardized units rather than raw figures, the tool behaves consistently across different instruments, sessions, and volatility regimes. A reading that is "extreme" on a low-volatility forex pair is measured by the same logic as one on a high-volatility index future.
Core Features
1. Order Flow Bubbles
Each bar is marked with a circle plotted at the volume-weighted average price of its intrabar activity — clamped within the bar's range — so the bubble sits where the trading actually concentrated, not simply at the close. The size of each bubble scales with the standardized magnitude of that bar's delta, emphasizing statistically rare bursts of activity, while its color shifts across a gradient between the buyer and seller colors according to the net direction of flow. Large, vividly colored bubbles flag bars where one side committed disproportionate volume — frequently the footprints left at turning points, breakouts, and absorption events.
2. Extreme Order Flow Zones
A rolling cumulative pressure series is compared against its own distribution over a 200-bar window. When buying or selling pressure pushes beyond its 99th or 1st percentile, the background is highlighted in the corresponding color. These zones isolate the moments when order flow becomes genuinely exhausted or climactic, rather than merely strong — a context filter that helps distinguish ordinary momentum from potential capitulation and blow-off conditions.
3. Cumulative Delta Driver
The centerpiece oscillator is a composite driver built from three independent inputs: a short-term buy-versus-sell volume imbalance, a medium-term cumulative normalized delta, and a price-action pressure proxy that classifies each bar by its rejection, absorption, and breakout characteristics. These are blended into a single line — with the intrabar delta component carrying the heaviest weight — and rendered with a directional fill above and below the zero line. The driver is designed to express the underlying current of order flow rather than price itself, often leading or diverging from price during accumulation and distribution phases.
4. Order Flow Divergences
The tool continuously tracks confirmed price pivots and records the value of the Cumulative Delta Driver at each one. When price prints a lower low while the driver prints a higher low, a bullish divergence line is drawn; when price prints a higher high while the driver prints a lower high, a bearish divergence line is drawn. These automatically plotted connections highlight situations where price extension is no longer supported by underlying flow — a classic early-warning signature of weakening conviction.
Settings
Resolution — sets the lower timeframe used to reconstruct intrabar order flow. Selecting a finer resolution increases the granularity of the delta calculation; leaving it empty defaults to chart-level data.
Bubbles — toggles the on-chart volume bubbles.
Bubble Adjustment — shifts the overall sizing of the bubbles to suit different instruments and chart scales.
Extreme — toggles the percentile-based extreme background zones.
Extreme Length — controls the lookback of the cumulative pressure series that feeds the extreme detection.
Buyers / Sellers Colors — fully customizable color scheme applied consistently across bubbles, extremes, the driver fill, and divergence lines.
How To Use It
The four layers are intended to be read together. Use the bubbles to spot where and how aggressively volume is being placed in real time, the extreme zones to frame those bursts within a statistical context, the Cumulative Delta Driver to gauge the broader balance of pressure, and the divergences to anticipate exhaustion before it appears in price. Confluence between an extreme zone, a large opposing bubble, and a fresh divergence is generally the most actionable configuration. The tool is built as a discretionary decision-support layer and pairs naturally with structure-based methods such as support and resistance, order blocks, or trend analysis.
Notes
Order-flow reconstruction depends on the availability of lower-timeframe data for the selected symbol; instruments without volume cannot be analyzed. Divergence lines are based on confirmed pivots and therefore appear after the pivot's confirmation delay, which is normal behavior for pivot-based logic and not a repainting artifact. As with all volume and delta tooling, results should be interpreted as probabilistic context, not as standalone signals.
Disclaimer
This indicator is provided for informational and educational purposes only and does not constitute financial advice. Trading involves substantial risk, and past behavior of any tool or market is not indicative of future results. Always conduct your own analysis and manage risk accordingly.
Overview
The Orderflow Tool is a volume-based analytical suite that reconstructs buying and selling pressure directly from intrabar data and presents it through four complementary layers: directional volume bubbles on the chart, statistically defined extreme order-flow zones, a multi-factor cumulative delta oscillator, and an automated divergence engine. Rather than relying on a single volume metric, the tool blends raw delta, normalized volume imbalance, and price-action behavior into one coherent reading of who is in control of the market — buyers or sellers — and how committed they are.
The indicator works on any symbol that provides volume data and on any chart timeframe.
How It Works
At its core, the tool pulls lower-timeframe data through TradingView's intrabar engine to estimate volume delta — the difference between volume traded on up-closing intrabars and volume traded on down-closing intrabars. This produces a far more granular picture of net aggression than standard bar volume, without requiring tick-level feeds.
Every derived metric is statistically normalized against its own recent standard deviation. This is a deliberate design choice: by expressing delta, volume, and imbalance in standardized units rather than raw figures, the tool behaves consistently across different instruments, sessions, and volatility regimes. A reading that is "extreme" on a low-volatility forex pair is measured by the same logic as one on a high-volatility index future.
Core Features
1. Order Flow Bubbles
Each bar is marked with a circle plotted at the volume-weighted average price of its intrabar activity — clamped within the bar's range — so the bubble sits where the trading actually concentrated, not simply at the close. The size of each bubble scales with the standardized magnitude of that bar's delta, emphasizing statistically rare bursts of activity, while its color shifts across a gradient between the buyer and seller colors according to the net direction of flow. Large, vividly colored bubbles flag bars where one side committed disproportionate volume — frequently the footprints left at turning points, breakouts, and absorption events.
2. Extreme Order Flow Zones
A rolling cumulative pressure series is compared against its own distribution over a 200-bar window. When buying or selling pressure pushes beyond its 99th or 1st percentile, the background is highlighted in the corresponding color. These zones isolate the moments when order flow becomes genuinely exhausted or climactic, rather than merely strong — a context filter that helps distinguish ordinary momentum from potential capitulation and blow-off conditions.
3. Cumulative Delta Driver
The centerpiece oscillator is a composite driver built from three independent inputs: a short-term buy-versus-sell volume imbalance, a medium-term cumulative normalized delta, and a price-action pressure proxy that classifies each bar by its rejection, absorption, and breakout characteristics. These are blended into a single line — with the intrabar delta component carrying the heaviest weight — and rendered with a directional fill above and below the zero line. The driver is designed to express the underlying current of order flow rather than price itself, often leading or diverging from price during accumulation and distribution phases.
4. Order Flow Divergences
The tool continuously tracks confirmed price pivots and records the value of the Cumulative Delta Driver at each one. When price prints a lower low while the driver prints a higher low, a bullish divergence line is drawn; when price prints a higher high while the driver prints a lower high, a bearish divergence line is drawn. These automatically plotted connections highlight situations where price extension is no longer supported by underlying flow — a classic early-warning signature of weakening conviction.
Settings
Resolution — sets the lower timeframe used to reconstruct intrabar order flow. Selecting a finer resolution increases the granularity of the delta calculation; leaving it empty defaults to chart-level data.
Bubbles — toggles the on-chart volume bubbles.
Bubble Adjustment — shifts the overall sizing of the bubbles to suit different instruments and chart scales.
Extreme — toggles the percentile-based extreme background zones.
Extreme Length — controls the lookback of the cumulative pressure series that feeds the extreme detection.
Buyers / Sellers Colors — fully customizable color scheme applied consistently across bubbles, extremes, the driver fill, and divergence lines.
How To Use It
The four layers are intended to be read together. Use the bubbles to spot where and how aggressively volume is being placed in real time, the extreme zones to frame those bursts within a statistical context, the Cumulative Delta Driver to gauge the broader balance of pressure, and the divergences to anticipate exhaustion before it appears in price. Confluence between an extreme zone, a large opposing bubble, and a fresh divergence is generally the most actionable configuration. The tool is built as a discretionary decision-support layer and pairs naturally with structure-based methods such as support and resistance, order blocks, or trend analysis.
Notes
Order-flow reconstruction depends on the availability of lower-timeframe data for the selected symbol; instruments without volume cannot be analyzed. Divergence lines are based on confirmed pivots and therefore appear after the pivot's confirmation delay, which is normal behavior for pivot-based logic and not a repainting artifact. As with all volume and delta tooling, results should be interpreted as probabilistic context, not as standalone signals.
Disclaimer
This indicator is provided for informational and educational purposes only and does not constitute financial advice. Trading involves substantial risk, and past behavior of any tool or market is not indicative of future results. Always conduct your own analysis and manage risk accordingly.
유료 공간에서 이용 가능
이 지표는 Quant Suite 구독자만 이용할 수 있습니다. 가입하여 OmegaTools의 스크립트를 포함하여 다양한 스크립트에 접근하세요.

면책사항
해당 정보와 게시물은 금융, 투자, 트레이딩 또는 기타 유형의 조언이나 권장 사항으로 간주되지 않으며, 트레이딩뷰에서 제공하거나 보증하는 것이 아닙니다. 자세한 내용은 이용 약관을 참조하세요.
유료 공간에서 이용 가능
이 지표는 Quant Suite 구독자만 이용할 수 있습니다. 가입하여 OmegaTools의 스크립트를 포함하여 다양한 스크립트에 접근하세요.
면책사항
해당 정보와 게시물은 금융, 투자, 트레이딩 또는 기타 유형의 조언이나 권장 사항으로 간주되지 않으며, 트레이딩뷰에서 제공하거나 보증하는 것이 아닙니다. 자세한 내용은 이용 약관을 참조하세요.