FPD
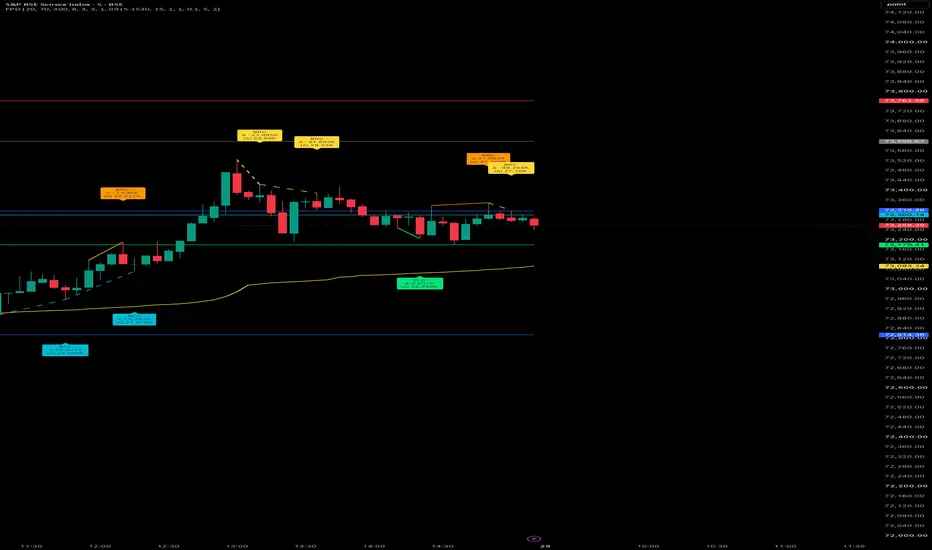
# FPD — Footprint & Price Dynamics
### Order Flow, Delta Divergence and Market Structure
## Overview
FPD (Footprint & Price Dynamics) is a TradingView indicator designed to help traders study market structure, order-flow dynamics and price movement in a single analytical framework.
By combining footprint-based information, delta analysis and structural price pivots, FPD helps traders investigate potential buying and selling pressure, identify divergence between price and delta, and assess possible continuation or reversal setups.
FPD is an **analytical tool for informed decision-making**, not a standalone buy/sell signal generator. Its purpose is to provide additional context for your own market analysis and trading decisions.
## Key Features
- **Footprint-based analysis:** Uses TradingView footprint data to examine buying and selling activity.
- **Delta divergence:** Highlights potential mismatches between price structure and cumulative delta.
- **Market structure:** Identifies potential bullish and bearish continuation patterns.
- **Session context:** Includes session-related reference information such as VWAP, opening range and previous-day price levels.
- **Configurable parameters:** Allows users to adjust sensitivity and other analysis settings.
- **Alert support:** Provides alerts for supported structural signals.
## Understanding the Signals
**BLD — Bullish Delta Divergence**
Identifies a potential bullish divergence when price forms a lower low while cumulative delta forms a higher low, subject to the indicator’s filters.
**BRD — Bearish Delta Divergence**
Identifies a potential bearish divergence when price forms a higher high while cumulative delta forms a lower high, subject to the indicator’s filters.
**BLC — Bullish Continuation**
Identifies a potential bullish continuation structure based on a higher low, with optional delta-structure confirmation.
**BRC — Bearish Continuation**
Identifies a potential bearish continuation structure based on a lower high, with optional delta-structure confirmation.
These signals identify conditions worth investigating. They do not guarantee a reversal, continuation or profitable trade.
## Three Important Things to Know Before Using FPD
### 1. TradingView Subscription Requirements
FPD uses TradingView's `request.footprint()` functionality. **A TradingView Premium or Ultimate subscription is required for this functionality.**
Footprint data availability may also vary depending on the symbol, exchange, data feed and chart conditions. Please verify that your TradingView account supports the required functionality before using FPD.
### 2. Timeframe and Instrument Compatibility Must Be Verified
FPD includes session-based calculations and market references, including session VWAP, cumulative delta and opening-range logic. These calculations may behave differently across intraday and daily charts, and across instruments with different trading sessions.
**Do not assume that FPD works identically on every timeframe or instrument.** Validate its behaviour on the specific markets and timeframes you intend to trade before relying on its signals.
In particular, daily-chart and swing-trading use should be tested carefully rather than assumed to be equivalent to intraday use.
### 3. Historical Signals and Real-Time Signals Can Differ
FPD uses confirmed price pivots to identify certain structural patterns. A pivot may require subsequent candles before it can be confirmed.
**A signal displayed on an earlier historical candle may only have become identifiable after one or more later candles formed.** Consequently, the historical location of a label does not necessarily represent the time at which the signal first became actionable.
When evaluating FPD, distinguish between where a signal is plotted and when it could actually have been known in real time. Test signals bar by bar before drawing conclusions about their usefulness or performance.
## Suggested Approach to Using FPD
1. Establish the broader price structure and market context.
2. Examine the relevant footprint and delta information.
3. Use divergence and continuation signals to identify potential setups for further analysis.
4. Consider relevant price levels, session context and other independent evidence.
5. Define trade entry, invalidation, position sizing and risk limits separately.
Users should validate the indicator on their own instruments and timeframes and avoid relying on any single signal in isolation.
## Important Limitations
- Market data and footprint availability depend on TradingView and the relevant instrument.
- Indicator settings can materially affect the signals produced.
- Pivot-based signals involve confirmation delays.
- Session-dependent calculations may require additional validation on non-intraday charts.
- No signal guarantees a profitable outcome, and historical patterns may not repeat.
## Risk Disclaimer
FPD is provided for educational and analytical purposes only. It does not constitute financial, investment or trading advice, and it does not guarantee accuracy, profitability or future market performance.
Trading financial instruments involves substantial risk, including the possible loss of capital. Always conduct your own research, test strategies appropriately and make trading decisions in accordance with your own risk tolerance and financial circumstances.
**Use FPD as an aid to analysis—not as a substitute for independent judgement or risk management.**
### Order Flow, Delta Divergence and Market Structure
## Overview
FPD (Footprint & Price Dynamics) is a TradingView indicator designed to help traders study market structure, order-flow dynamics and price movement in a single analytical framework.
By combining footprint-based information, delta analysis and structural price pivots, FPD helps traders investigate potential buying and selling pressure, identify divergence between price and delta, and assess possible continuation or reversal setups.
FPD is an **analytical tool for informed decision-making**, not a standalone buy/sell signal generator. Its purpose is to provide additional context for your own market analysis and trading decisions.
## Key Features
- **Footprint-based analysis:** Uses TradingView footprint data to examine buying and selling activity.
- **Delta divergence:** Highlights potential mismatches between price structure and cumulative delta.
- **Market structure:** Identifies potential bullish and bearish continuation patterns.
- **Session context:** Includes session-related reference information such as VWAP, opening range and previous-day price levels.
- **Configurable parameters:** Allows users to adjust sensitivity and other analysis settings.
- **Alert support:** Provides alerts for supported structural signals.
## Understanding the Signals
**BLD — Bullish Delta Divergence**
Identifies a potential bullish divergence when price forms a lower low while cumulative delta forms a higher low, subject to the indicator’s filters.
**BRD — Bearish Delta Divergence**
Identifies a potential bearish divergence when price forms a higher high while cumulative delta forms a lower high, subject to the indicator’s filters.
**BLC — Bullish Continuation**
Identifies a potential bullish continuation structure based on a higher low, with optional delta-structure confirmation.
**BRC — Bearish Continuation**
Identifies a potential bearish continuation structure based on a lower high, with optional delta-structure confirmation.
These signals identify conditions worth investigating. They do not guarantee a reversal, continuation or profitable trade.
## Three Important Things to Know Before Using FPD
### 1. TradingView Subscription Requirements
FPD uses TradingView's `request.footprint()` functionality. **A TradingView Premium or Ultimate subscription is required for this functionality.**
Footprint data availability may also vary depending on the symbol, exchange, data feed and chart conditions. Please verify that your TradingView account supports the required functionality before using FPD.
### 2. Timeframe and Instrument Compatibility Must Be Verified
FPD includes session-based calculations and market references, including session VWAP, cumulative delta and opening-range logic. These calculations may behave differently across intraday and daily charts, and across instruments with different trading sessions.
**Do not assume that FPD works identically on every timeframe or instrument.** Validate its behaviour on the specific markets and timeframes you intend to trade before relying on its signals.
In particular, daily-chart and swing-trading use should be tested carefully rather than assumed to be equivalent to intraday use.
### 3. Historical Signals and Real-Time Signals Can Differ
FPD uses confirmed price pivots to identify certain structural patterns. A pivot may require subsequent candles before it can be confirmed.
**A signal displayed on an earlier historical candle may only have become identifiable after one or more later candles formed.** Consequently, the historical location of a label does not necessarily represent the time at which the signal first became actionable.
When evaluating FPD, distinguish between where a signal is plotted and when it could actually have been known in real time. Test signals bar by bar before drawing conclusions about their usefulness or performance.
## Suggested Approach to Using FPD
1. Establish the broader price structure and market context.
2. Examine the relevant footprint and delta information.
3. Use divergence and continuation signals to identify potential setups for further analysis.
4. Consider relevant price levels, session context and other independent evidence.
5. Define trade entry, invalidation, position sizing and risk limits separately.
Users should validate the indicator on their own instruments and timeframes and avoid relying on any single signal in isolation.
## Important Limitations
- Market data and footprint availability depend on TradingView and the relevant instrument.
- Indicator settings can materially affect the signals produced.
- Pivot-based signals involve confirmation delays.
- Session-dependent calculations may require additional validation on non-intraday charts.
- No signal guarantees a profitable outcome, and historical patterns may not repeat.
## Risk Disclaimer
FPD is provided for educational and analytical purposes only. It does not constitute financial, investment or trading advice, and it does not guarantee accuracy, profitability or future market performance.
Trading financial instruments involves substantial risk, including the possible loss of capital. Always conduct your own research, test strategies appropriately and make trading decisions in accordance with your own risk tolerance and financial circumstances.
**Use FPD as an aid to analysis—not as a substitute for independent judgement or risk management.**

면책사항
해당 정보와 게시물은 금융, 투자, 트레이딩 또는 기타 유형의 조언이나 권장 사항으로 간주되지 않으며, 트레이딩뷰에서 제공하거나 보증하는 것이 아닙니다. 자세한 내용은 이용 약관을 참조하세요.
면책사항
해당 정보와 게시물은 금융, 투자, 트레이딩 또는 기타 유형의 조언이나 권장 사항으로 간주되지 않으며, 트레이딩뷰에서 제공하거나 보증하는 것이 아닙니다. 자세한 내용은 이용 약관을 참조하세요.