업데이트됨
N-Bar Clock Audit
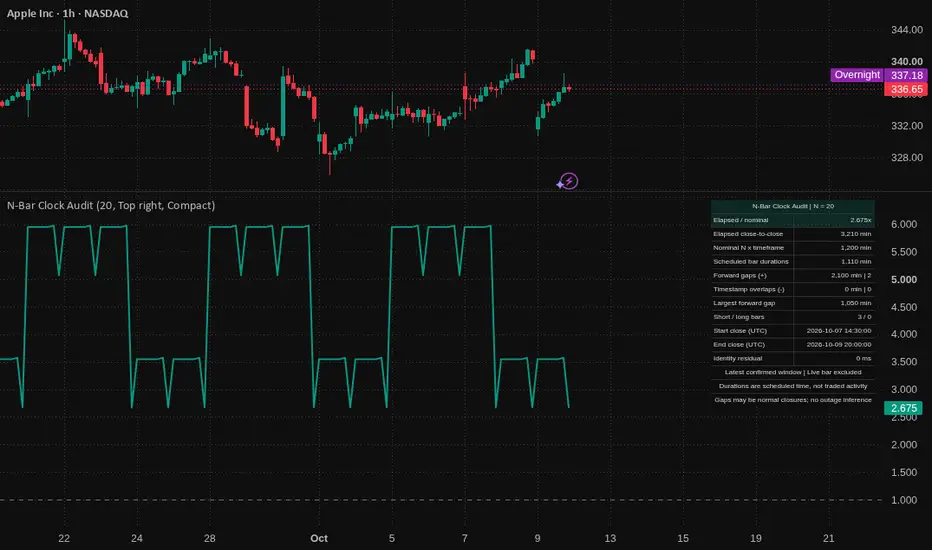
N-Bar Clock Audit
PURPOSE
A 20-bar lookback on an hourly chart does not always represent 20 elapsed hours. Session closures, weekends, omitted chart sessions and shortened final session bars change its clock-time span. This educational diagnostic makes that difference measurable before comparing bar-based research across instruments or chart settings.
The script plots the elapsed-to-nominal time ratio of a rolling, confirmed close-to-close horizon. Its table reconciles that horizon into scheduled bar durations, forward gaps and timestamp overlaps, with exact UTC endpoints and a numerical identity check. It does not analyze price direction or produce buy/sell signals.
WHAT N MEANS
The start is the close timestamp N bars ago. The end is the latest confirmed bar's close timestamp. The N intervening bars, including the bar ending the window, supply N bar durations and N transitions from the preceding close to the next open. N + 1 chart bars must therefore be available.
This is a close-to-close horizon, such as the timestamp span underlying a comparison of close with close[N]. It is not the open-to-close width of a set of N candles. For N = 1, an overnight break belongs to the window if the current bar opens after the previous bar's close.
METHOD
For each of the N bars:
- Scheduled duration = current close timestamp minus current open timestamp
- Forward gap = max(current open timestamp minus preceding close timestamp, 0)
- Timestamp overlap = max(preceding close timestamp minus current open timestamp, 0)
The exact reconciliation is:
Elapsed time = sum of scheduled durations + sum of forward gaps - sum of timestamp overlaps.
This is an accounting and indexing check, not evidence that the feed is complete.
Nominal time = N multiplied by the chart timeframe's fixed duration. The plotted ratio equals elapsed time divided by nominal time. A reading of 3.500x means that this close-to-close horizon spans 3.5 times its nominal duration. The dashed 1x line is a time reference, not a trading threshold.
The table also reports the number and largest size of forward gaps, the number of overlaps, and counts of bars shorter or longer than the nominal timeframe. A shortened last bar of a session can reduce the scheduled-duration sum without creating a gap. The identity residual should be zero milliseconds for a valid window. Windows containing unavailable timestamps, non-positive bar durations, or a non-positive total elapsed span show an invalid-window state with no metrics rather than silently substituting data.
USING IT
Use standard, time-based intraday seconds or minute/hour charts. Daily, weekly, monthly, tick and synthetic charts are intentionally blocked because this release uses a fixed intraday duration baseline. The default N = 20 is illustrative and is not optimized. N can range from 1 to 2000.
Compare the same N on a continuously traded instrument and on a session-limited instrument, or compare regular and extended chart sessions where your data plan permits. Inspect how much of a particular lookback is scheduled bar time versus time between included bars. Use the Data Window to inspect historical ratios and their components. Changing N defines a different horizon; changing the session setting changes the underlying chart dataset.
The table always shows the latest confirmed window, not the bar under the cursor. Start and end timestamps are explicitly UTC, independent of the chart's visual timezone. Values are displayed in minutes, including fractional minutes on seconds charts. The table can be hidden or moved to any corner.
CONFIRMATION AND HISTORY
Calculations use only the chart's own opening and closing timestamps. There are no external symbol requests, future offsets, or lookahead calls. A live bar's scheduled close does not mean it has finished: its plot is blank until confirmation, and the table retains the previous confirmed window. Historical plots are placed at the bar where each window ends, with no backward placement.
WHAT IS DISTINCT
This is a rolling horizon audit, rather than a candle countdown, session overlay or marker that calls every time gap a missing bar. Its contribution is the exact close-to-close decomposition, explicit N + 1 anchor rule, shortened-bar and overlap diagnostics, confirmed-window handling, and inspectable reconciliation in one small tool. Timestamp subtraction and rolling sums are standard building blocks; this implementation was written independently, without copying another author's script. It serves a different purpose from Range Breakout Outcome Audit, which studies subsequent price-barrier outcomes.
LIMITATIONS
Forward gaps may be ordinary overnight or weekend closures, holidays, omitted sessions, intervals with no trades, or data irregularities. The script cannot distinguish these causes and does not label them outages or missing trades. It has no exchange calendar and does not reconstruct absent bars.
Scheduled bar duration is the span between chart timestamps, not measured time spent trading or guaranteed data coverage. An overlap is a timestamp diagnostic; it is not overlapping positions. A ratio below 1 can result from shortened bars and is not automatically an error. Clock arithmetic uses absolute timestamps, so timezone-display changes cannot alter the arithmetic; changes in session schedules can.
The audit sees only loaded chart data. Session selection, feed revisions and data availability can change its results. A ratio of 1 can hide offsetting shortened bars and gaps; inspect the components rather than treating 1 as a completeness score. Adjacent rolling windows overlap heavily and are not independent samples. No statistical reliability, strategy performance, profitability, execution quality or future-price claim is made. Use the result as context for bar-based research, not as a trading recommendation.
PURPOSE
A 20-bar lookback on an hourly chart does not always represent 20 elapsed hours. Session closures, weekends, omitted chart sessions and shortened final session bars change its clock-time span. This educational diagnostic makes that difference measurable before comparing bar-based research across instruments or chart settings.
The script plots the elapsed-to-nominal time ratio of a rolling, confirmed close-to-close horizon. Its table reconciles that horizon into scheduled bar durations, forward gaps and timestamp overlaps, with exact UTC endpoints and a numerical identity check. It does not analyze price direction or produce buy/sell signals.
WHAT N MEANS
The start is the close timestamp N bars ago. The end is the latest confirmed bar's close timestamp. The N intervening bars, including the bar ending the window, supply N bar durations and N transitions from the preceding close to the next open. N + 1 chart bars must therefore be available.
This is a close-to-close horizon, such as the timestamp span underlying a comparison of close with close[N]. It is not the open-to-close width of a set of N candles. For N = 1, an overnight break belongs to the window if the current bar opens after the previous bar's close.
METHOD
For each of the N bars:
- Scheduled duration = current close timestamp minus current open timestamp
- Forward gap = max(current open timestamp minus preceding close timestamp, 0)
- Timestamp overlap = max(preceding close timestamp minus current open timestamp, 0)
The exact reconciliation is:
Elapsed time = sum of scheduled durations + sum of forward gaps - sum of timestamp overlaps.
This is an accounting and indexing check, not evidence that the feed is complete.
Nominal time = N multiplied by the chart timeframe's fixed duration. The plotted ratio equals elapsed time divided by nominal time. A reading of 3.500x means that this close-to-close horizon spans 3.5 times its nominal duration. The dashed 1x line is a time reference, not a trading threshold.
The table also reports the number and largest size of forward gaps, the number of overlaps, and counts of bars shorter or longer than the nominal timeframe. A shortened last bar of a session can reduce the scheduled-duration sum without creating a gap. The identity residual should be zero milliseconds for a valid window. Windows containing unavailable timestamps, non-positive bar durations, or a non-positive total elapsed span show an invalid-window state with no metrics rather than silently substituting data.
USING IT
Use standard, time-based intraday seconds or minute/hour charts. Daily, weekly, monthly, tick and synthetic charts are intentionally blocked because this release uses a fixed intraday duration baseline. The default N = 20 is illustrative and is not optimized. N can range from 1 to 2000.
Compare the same N on a continuously traded instrument and on a session-limited instrument, or compare regular and extended chart sessions where your data plan permits. Inspect how much of a particular lookback is scheduled bar time versus time between included bars. Use the Data Window to inspect historical ratios and their components. Changing N defines a different horizon; changing the session setting changes the underlying chart dataset.
The table always shows the latest confirmed window, not the bar under the cursor. Start and end timestamps are explicitly UTC, independent of the chart's visual timezone. Values are displayed in minutes, including fractional minutes on seconds charts. The table can be hidden or moved to any corner.
CONFIRMATION AND HISTORY
Calculations use only the chart's own opening and closing timestamps. There are no external symbol requests, future offsets, or lookahead calls. A live bar's scheduled close does not mean it has finished: its plot is blank until confirmation, and the table retains the previous confirmed window. Historical plots are placed at the bar where each window ends, with no backward placement.
WHAT IS DISTINCT
This is a rolling horizon audit, rather than a candle countdown, session overlay or marker that calls every time gap a missing bar. Its contribution is the exact close-to-close decomposition, explicit N + 1 anchor rule, shortened-bar and overlap diagnostics, confirmed-window handling, and inspectable reconciliation in one small tool. Timestamp subtraction and rolling sums are standard building blocks; this implementation was written independently, without copying another author's script. It serves a different purpose from Range Breakout Outcome Audit, which studies subsequent price-barrier outcomes.
LIMITATIONS
Forward gaps may be ordinary overnight or weekend closures, holidays, omitted sessions, intervals with no trades, or data irregularities. The script cannot distinguish these causes and does not label them outages or missing trades. It has no exchange calendar and does not reconstruct absent bars.
Scheduled bar duration is the span between chart timestamps, not measured time spent trading or guaranteed data coverage. An overlap is a timestamp diagnostic; it is not overlapping positions. A ratio below 1 can result from shortened bars and is not automatically an error. Clock arithmetic uses absolute timestamps, so timezone-display changes cannot alter the arithmetic; changes in session schedules can.
The audit sees only loaded chart data. Session selection, feed revisions and data availability can change its results. A ratio of 1 can hide offsetting shortened bars and gaps; inspect the components rather than treating 1 as a completeness score. Adjacent rolling windows overlap heavily and are not independent samples. No statistical reliability, strategy performance, profitability, execution quality or future-price claim is made. Use the result as context for bar-based research, not as a trading recommendation.
릴리즈 노트
Table layout updateAdded a Table text size input with Compact (default), Standard, and Large options. Compact uses smaller text to reduce clipping in shorter indicator panes, keeping the status and both caution rows visible in this updated chart. Standard restores the previous text size; Large improves readability when there is more space.
The size applies consistently to the header, data rows, status and cautions. Existing corner and show/hide controls remain available. Very short panes may still need more height, particularly with Standard or Large text.
This is a layout-only update. The close-to-close clock decomposition, confirmed-window handling, chart guards, plots and Data Window outputs are unchanged. It adds no trading signals or performance claims.

면책사항
해당 정보와 게시물은 금융, 투자, 트레이딩 또는 기타 유형의 조언이나 권장 사항으로 간주되지 않으며, 트레이딩뷰에서 제공하거나 보증하는 것이 아닙니다. 자세한 내용은 이용 약관을 참조하세요.
면책사항
해당 정보와 게시물은 금융, 투자, 트레이딩 또는 기타 유형의 조언이나 권장 사항으로 간주되지 않으며, 트레이딩뷰에서 제공하거나 보증하는 것이 아닙니다. 자세한 내용은 이용 약관을 참조하세요.