OPEN-SOURCE SCRIPT
Multi-Oscillator Divergence Confluence
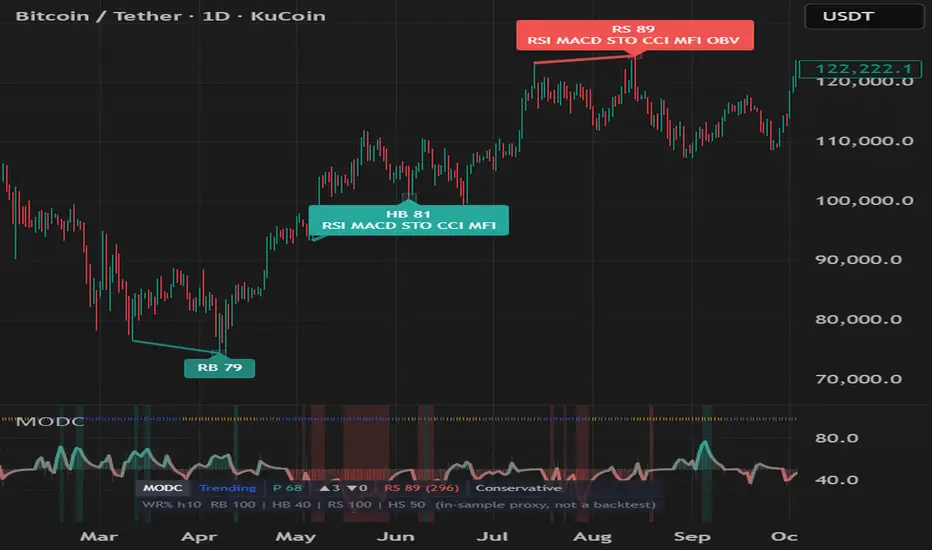
Multi-Oscillator Divergence Confluence (MODC)
MODC is a three-layer divergence analysis indicator built to make oscillator divergence easier to read without turning the chart into a wall of labels.
The script evaluates RSI, MACD, Stochastic, CCI, MFI, and OBV at the same confirmed price pivots. This shared-pivot approach keeps oscillator votes aligned to the same market structure point instead of mixing unrelated oscillator pivots.
The goal is not to create a standalone buy/sell system. MODC is designed as a visual confirmation and context tool for traders who already use market structure, trend context, and risk management.
What makes MODC different
MODC is built as a three-layer system:
1. Always-on market context
The pane stays useful on every bar, even when no divergence signal is active.
It includes:
- A Confluence Pressure Wave from 0 to 100.
- A regime ribbon identifying Trending, Ranging, Volatile, or Quiet conditions using ADX and ATR percentile.
- An oscillator stack histogram showing whether more enabled oscillators are leaning bullish or bearish.
- Subtle pressure background zones when divergence pressure builds.
This layer helps show the “story” before a confirmed signal appears.
2. Informational Setup layer
In Exploratory mode, subtle setup dots appear when divergence pressure builds near a recent swing extreme.
A Setup is not a confirmed divergence signal. It is only a watch-list event.
Setup dots require:
- Pressure wave crossover.
- At least two oscillators leaning in the same direction.
- Price near a recent swing high or swing low using ATR-based proximity.
Setup alerts are disabled by default because Setups are pre-confirmation events and may never become confirmed pivot divergences.
3. Confirmed Valid and Elite signals
Confirmed signals are based on price pivots. A pivot only confirms after the selected Pivot Right Bars have closed.
Valid signals require:
- A confirmed price pivot.
- Minimum oscillator confluence.
- A base score threshold.
- Hidden divergences aligned with EMA context.
Elite signals require Valid conditions plus a stricter quality gate:
- EMA context.
- ADX trend-strength rules.
- Regime-adaptive score threshold.
- Optional volume gate.
- Optional historical forward-return proxy gate.
Signal labels are compact:
- RB = Regular Bullish
- HB = Hidden Bullish
- RS = Regular Bearish
- HS = Hidden Bearish
The number beside the label is the signal score. Visual intensity scales with score:
- 50-65 = muted
- 66-79 = clear
- 80+ = premium / Elite
How the scoring works
Scoring is intentionally conservative and always based on confluence out of six oscillators. Disabling oscillators does not inflate the score.
The score considers:
- Oscillator confluence count.
- Correct reversal or continuation context.
- Whether enabled oscillators are in exhaustion zones.
- Volume participation.
- Pivot spacing quality.
- Market regime alignment.
- A penalty when fewer than four oscillators are enabled.
Regular divergence and hidden divergence are treated differently:
- Regular Bullish = potential reversal from weakness.
- Regular Bearish = potential reversal from strength.
- Hidden Bullish = potential trend continuation above the EMA.
- Hidden Bearish = potential trend continuation below the EMA.
Display modes
Signal Density:
- Conservative: Elite only.
- Balanced: Valid + Elite. This is the default.
- Exploratory: Setup + Valid + Elite.
Visual Intensity:
- Minimal: pressure wave and confirmed badges only.
- Standard: pressure wave, regime ribbon, stack histogram, confirmed lines and badges.
- Cinematic: Standard mode plus Elite aura, candle tint, stronger atmosphere, and compact HUD stats.
Suggested usage
Start with:
- Signal Density: Balanced
- Visual Intensity: Standard
Use Layer 1 to understand market context. Treat Setup dots as early watch-list information only. Use Valid and Elite signals as confirmation points, not automatic entries.
For alerts, use the confirmed Valid or Elite alert conditions and set alerts to Once Per Bar Close.
Repaint and delay disclosure
Confirmed Valid and Elite outputs are evaluated on closed bars.
Because this script uses confirmed pivots, a divergence signal is only known after Pivot Right Bars have closed. The marker is drawn back on the pivot bar for visual alignment only. The signal was not actionable on the original pivot bar.
The Setup layer is different: Setups are informational pressure events, not confirmed divergence signals. They may never become confirmed signals.
Forward-return proxy disclosure
MODC includes optional forward-return proxy statistics for visible chart history. These are in-sample summaries only.
They are not a backtest. They do not include commissions, slippage, position sizing, stops, targets, or risk management. They should not be interpreted as expected future performance.
Limitations
Divergence can fail, especially during strong trends or news-driven moves. Oscillators are related momentum tools, so confluence does not guarantee independence. This indicator should be used with broader market structure, trend analysis, and a defined risk plan.
This script is for analysis and education only. It is not financial advice and is not a standalone trading system.
MODC is a three-layer divergence analysis indicator built to make oscillator divergence easier to read without turning the chart into a wall of labels.
The script evaluates RSI, MACD, Stochastic, CCI, MFI, and OBV at the same confirmed price pivots. This shared-pivot approach keeps oscillator votes aligned to the same market structure point instead of mixing unrelated oscillator pivots.
The goal is not to create a standalone buy/sell system. MODC is designed as a visual confirmation and context tool for traders who already use market structure, trend context, and risk management.
What makes MODC different
MODC is built as a three-layer system:
1. Always-on market context
The pane stays useful on every bar, even when no divergence signal is active.
It includes:
- A Confluence Pressure Wave from 0 to 100.
- A regime ribbon identifying Trending, Ranging, Volatile, or Quiet conditions using ADX and ATR percentile.
- An oscillator stack histogram showing whether more enabled oscillators are leaning bullish or bearish.
- Subtle pressure background zones when divergence pressure builds.
This layer helps show the “story” before a confirmed signal appears.
2. Informational Setup layer
In Exploratory mode, subtle setup dots appear when divergence pressure builds near a recent swing extreme.
A Setup is not a confirmed divergence signal. It is only a watch-list event.
Setup dots require:
- Pressure wave crossover.
- At least two oscillators leaning in the same direction.
- Price near a recent swing high or swing low using ATR-based proximity.
Setup alerts are disabled by default because Setups are pre-confirmation events and may never become confirmed pivot divergences.
3. Confirmed Valid and Elite signals
Confirmed signals are based on price pivots. A pivot only confirms after the selected Pivot Right Bars have closed.
Valid signals require:
- A confirmed price pivot.
- Minimum oscillator confluence.
- A base score threshold.
- Hidden divergences aligned with EMA context.
Elite signals require Valid conditions plus a stricter quality gate:
- EMA context.
- ADX trend-strength rules.
- Regime-adaptive score threshold.
- Optional volume gate.
- Optional historical forward-return proxy gate.
Signal labels are compact:
- RB = Regular Bullish
- HB = Hidden Bullish
- RS = Regular Bearish
- HS = Hidden Bearish
The number beside the label is the signal score. Visual intensity scales with score:
- 50-65 = muted
- 66-79 = clear
- 80+ = premium / Elite
How the scoring works
Scoring is intentionally conservative and always based on confluence out of six oscillators. Disabling oscillators does not inflate the score.
The score considers:
- Oscillator confluence count.
- Correct reversal or continuation context.
- Whether enabled oscillators are in exhaustion zones.
- Volume participation.
- Pivot spacing quality.
- Market regime alignment.
- A penalty when fewer than four oscillators are enabled.
Regular divergence and hidden divergence are treated differently:
- Regular Bullish = potential reversal from weakness.
- Regular Bearish = potential reversal from strength.
- Hidden Bullish = potential trend continuation above the EMA.
- Hidden Bearish = potential trend continuation below the EMA.
Display modes
Signal Density:
- Conservative: Elite only.
- Balanced: Valid + Elite. This is the default.
- Exploratory: Setup + Valid + Elite.
Visual Intensity:
- Minimal: pressure wave and confirmed badges only.
- Standard: pressure wave, regime ribbon, stack histogram, confirmed lines and badges.
- Cinematic: Standard mode plus Elite aura, candle tint, stronger atmosphere, and compact HUD stats.
Suggested usage
Start with:
- Signal Density: Balanced
- Visual Intensity: Standard
Use Layer 1 to understand market context. Treat Setup dots as early watch-list information only. Use Valid and Elite signals as confirmation points, not automatic entries.
For alerts, use the confirmed Valid or Elite alert conditions and set alerts to Once Per Bar Close.
Repaint and delay disclosure
Confirmed Valid and Elite outputs are evaluated on closed bars.
Because this script uses confirmed pivots, a divergence signal is only known after Pivot Right Bars have closed. The marker is drawn back on the pivot bar for visual alignment only. The signal was not actionable on the original pivot bar.
The Setup layer is different: Setups are informational pressure events, not confirmed divergence signals. They may never become confirmed signals.
Forward-return proxy disclosure
MODC includes optional forward-return proxy statistics for visible chart history. These are in-sample summaries only.
They are not a backtest. They do not include commissions, slippage, position sizing, stops, targets, or risk management. They should not be interpreted as expected future performance.
Limitations
Divergence can fail, especially during strong trends or news-driven moves. Oscillators are related momentum tools, so confluence does not guarantee independence. This indicator should be used with broader market structure, trend analysis, and a defined risk plan.
This script is for analysis and education only. It is not financial advice and is not a standalone trading system.
오픈 소스 스크립트
트레이딩뷰의 진정한 정신에 따라, 이 스크립트의 작성자는 이를 오픈소스로 공개하여 트레이더들이 기능을 검토하고 검증할 수 있도록 했습니다. 작성자에게 찬사를 보냅니다! 이 코드는 무료로 사용할 수 있지만, 코드를 재게시하는 경우 하우스 룰이 적용된다는 점을 기억하세요.

면책사항
해당 정보와 게시물은 금융, 투자, 트레이딩 또는 기타 유형의 조언이나 권장 사항으로 간주되지 않으며, 트레이딩뷰에서 제공하거나 보증하는 것이 아닙니다. 자세한 내용은 이용 약관을 참조하세요.
오픈 소스 스크립트
트레이딩뷰의 진정한 정신에 따라, 이 스크립트의 작성자는 이를 오픈소스로 공개하여 트레이더들이 기능을 검토하고 검증할 수 있도록 했습니다. 작성자에게 찬사를 보냅니다! 이 코드는 무료로 사용할 수 있지만, 코드를 재게시하는 경우 하우스 룰이 적용된다는 점을 기억하세요.
면책사항
해당 정보와 게시물은 금융, 투자, 트레이딩 또는 기타 유형의 조언이나 권장 사항으로 간주되지 않으며, 트레이딩뷰에서 제공하거나 보증하는 것이 아닙니다. 자세한 내용은 이용 약관을 참조하세요.