MTF Swing Range Volume Profile
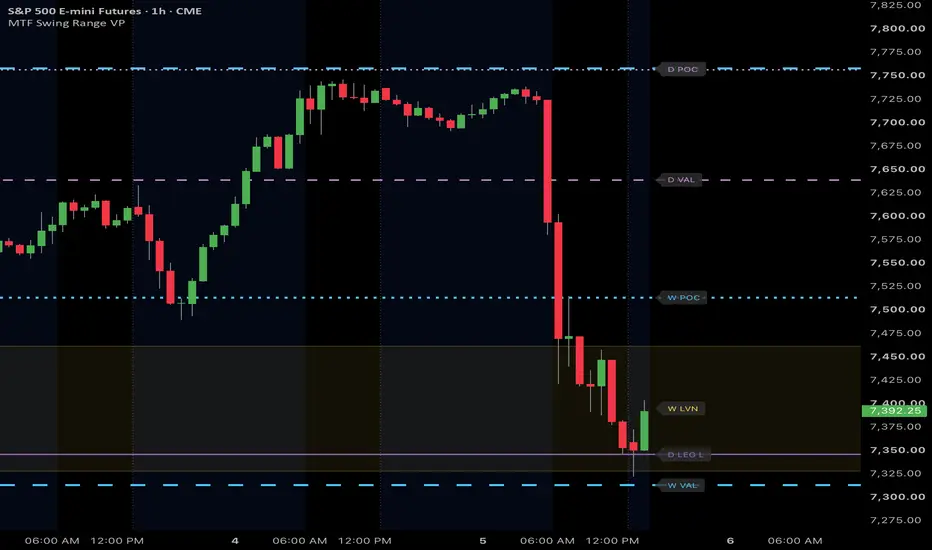
MTF Swing Range Volume Profile draws a volume profile of the latest swing leg found by an ATR reversal (zigzag-style) rule, with its POC, 70% value area and low-volume nodes (LVN). The anchors are the last two confirmed swing points on a timeframe you pick (D by default). With a hand-drawn Fixed Range Volume Profile you set both anchors and move them when a new swing forms; here the profile redraws when the next swing confirms.
It also draws the swing high and low and a histogram, and draws each LVN as a box with a fill state and, where one is found, a shelf line. One layer is on by default; a second, faster layer can be added.
WHAT IS ORIGINAL
The POC and the 70% value area follow the usual idea (the busiest price, and the range around it that holds 70% of the volume), with the exact rules under HOW IT WORKS. What this script adds:
HOW IT WORKS
Swings. Source bars are 5m for a 5m to 1H swing, 15m above 1H, 60m from D, 4H from W and D from M. ATR is the simple average of the true ranges of the last 14 completed swing periods like TradingView's ATR with Smoothing set to SMA (its default, RMA, is Wilder's smoothing). A swing high confirms on the first later source bar whose low is at least k ATR below it (k = 3 for the slow layer, 4 for the fast one); lows mirror this. A bar that makes a new extreme cannot confirm it.
Profile. Each source bar spreads its volume evenly over its high-low range, counting only the share inside the leg, so the profile is an estimate at the source bars' resolution (60m bars for a D swing). The histogram has 24 rows by default; rows 4 times finer place the POC, the value area and the area edges.
POC and value area. The POC is the fine row with the most volume inside the widest histogram row, so the POC line always crosses the widest bar. The value area grows from the POC one fine row at a time, adding whichever neighboring row holds more volume (the upper one on a tie), until it holds 70% of the leg's volume.
Low-volume nodes (LVN). A histogram valley qualifies when it sits at least 10% of the POC row (20% with Stricter) below the lower of the peaks on each side. The six deepest are kept per layer. Edges sit where the fine profile climbs a quarter of that depth above the valley floor (half with "LVN edges" set to Wide). Areas taller than 4 rows draw as an outline.
Shelves. On the steeper side of each area, a line marks the largest one-row volume jump between the area's edge and the next peak. No shelf is drawn when it sits on the area's edge. When a shelf is drawn, the area's label reads SHELF at the shelf price instead of LVN at its middle.
Fill. An area is filled once an average row's worth of volume per row of its height has traded inside it since the swing confirmed. "Fade, no label" (the default) dims its box and shelf line and removes its label; "Fade with label" keeps a faint label that adds "filled" ("D LVN filled", or "D SHELF (LVN filled)" when it has a shelf); Hide removes it; Off ignores fill. Fill is not tracked on LEG profiles.
LEG. A completed swing stays drawn until the next one confirms, which can take a while when price runs away without a big enough pullback. "Switch to the swing in progress" sets when the layer profiles the swing in progress instead, from the last confirmed swing point to its unconfirmed extreme (labeled LEG H or LEG L), until the next swing confirms. The switch, and every later move of the LEG end, happens only at a close of the swing timeframe (the daily close for a D swing), so a move during the period redraws nothing until it closes.
HOW TO USE IT
The profile maps where the latest swing traded heavily (POC, value area) and thinly (low-volume areas). Labels name the timeframe and the level ("D POC", "D SWING H", "D LVN") and merge when two levels share a price.
Colors mark the layer and the kind of level, never the side of price. The slow layer draws blue swing lines, a light blue POC and value area, yellow areas and a gray histogram; the fast layer uses purple, lavender and orange, with a purple histogram when that is turned on. No green or red is used. Swing lines are solid, the POC dotted, the value area dashed; line styles, widths, histogram color and histogram width can all be changed under Style.
Settings most people change:
On continuous futures (ES1!, MES1!) turn on back-adjustment, or a roll gap reads as a low-volume area. On stocks, set intraday charts to regular hours so they match the D chart.
REPAINTING AND DELAY
The calculation reads only completed source bars, so a reload, a settings change, bar replay and the live chart show the same thing, one source bar behind (5m, 15m, 60m, 4H or D). The bar before a session break shows at the next open. At or below the source timeframe the request uses lookahead on, and the function it evaluates reads only the previous source bar (high[1], low[1], close[1], volume[1], time[1]) plus whether a new swing period has started; that one-bar offset is what keeps lookahead from seeing the future. On a coarser chart the request uses lookahead off.
Exceptions:
Levels change when a swing confirms, a LEG updates or an area fills. A swing confirms only after the k ATR reversal, but its lines and histogram start at the leg's first bar and its areas at the leg's last bar, so they cover bars on which the leg was not yet known. Only the current leg is kept: scrolled back, you see the current levels, not what showed at the time, so price can look as if it reacted to a level before the level existed.
LIMITS
WHAT IT IS NOT
The swing high and low, POC and value area describe where the leg traded; they are not signals. Low-volume areas, shelves and the fill state are display aids. They have not been shown to give a trading edge, and the script makes no claim that price reacts at any level.
OPEN SOURCE
The source is published under the Mozilla Public License 2.0, so the request settings described above can be checked in the code.
For charting and study only. Not financial advice.
It also draws the swing high and low and a histogram, and draws each LVN as a box with a fill state and, where one is found, a shelf line. One layer is on by default; a second, faster layer can be added.
WHAT IS ORIGINAL
The POC and the 70% value area follow the usual idea (the busiest price, and the range around it that holds 70% of the volume), with the exact rules under HOW IT WORKS. What this script adds:
- The anchors come from a confirmed ATR reversal on a swing timeframe you choose, so nothing is placed or moved by hand. TradingView's Auto Anchored Volume Profile, set to Highest High or Lowest Low, starts at one extreme of the last N bars and runs to the last bar; here the profile runs between two confirmed swing points.
- The data comes from source bars fixed by that timeframe, not by the chart, so every chart from 1m up to the swing timeframe shows the same levels, given the same session and adjustment settings and enough loaded history (unless the swing timeframe is set to Chart).
- Only completed source bars are used, so a reload and the live chart agree, with the exceptions listed under REPAINTING AND DELAY.
- LVNs are picked by how far a valley sits below the peaks on both sides, with edges a quarter of the way up that depth (half with the Wide setting), and each can get a shelf line on its steeper side.
- Each area carries a fill state that fades it once enough volume has traded inside it.
HOW IT WORKS
Swings. Source bars are 5m for a 5m to 1H swing, 15m above 1H, 60m from D, 4H from W and D from M. ATR is the simple average of the true ranges of the last 14 completed swing periods like TradingView's ATR with Smoothing set to SMA (its default, RMA, is Wilder's smoothing). A swing high confirms on the first later source bar whose low is at least k ATR below it (k = 3 for the slow layer, 4 for the fast one); lows mirror this. A bar that makes a new extreme cannot confirm it.
Profile. Each source bar spreads its volume evenly over its high-low range, counting only the share inside the leg, so the profile is an estimate at the source bars' resolution (60m bars for a D swing). The histogram has 24 rows by default; rows 4 times finer place the POC, the value area and the area edges.
POC and value area. The POC is the fine row with the most volume inside the widest histogram row, so the POC line always crosses the widest bar. The value area grows from the POC one fine row at a time, adding whichever neighboring row holds more volume (the upper one on a tie), until it holds 70% of the leg's volume.
Low-volume nodes (LVN). A histogram valley qualifies when it sits at least 10% of the POC row (20% with Stricter) below the lower of the peaks on each side. The six deepest are kept per layer. Edges sit where the fine profile climbs a quarter of that depth above the valley floor (half with "LVN edges" set to Wide). Areas taller than 4 rows draw as an outline.
Shelves. On the steeper side of each area, a line marks the largest one-row volume jump between the area's edge and the next peak. No shelf is drawn when it sits on the area's edge. When a shelf is drawn, the area's label reads SHELF at the shelf price instead of LVN at its middle.
Fill. An area is filled once an average row's worth of volume per row of its height has traded inside it since the swing confirmed. "Fade, no label" (the default) dims its box and shelf line and removes its label; "Fade with label" keeps a faint label that adds "filled" ("D LVN filled", or "D SHELF (LVN filled)" when it has a shelf); Hide removes it; Off ignores fill. Fill is not tracked on LEG profiles.
LEG. A completed swing stays drawn until the next one confirms, which can take a while when price runs away without a big enough pullback. "Switch to the swing in progress" sets when the layer profiles the swing in progress instead, from the last confirmed swing point to its unconfirmed extreme (labeled LEG H or LEG L), until the next swing confirms. The switch, and every later move of the LEG end, happens only at a close of the swing timeframe (the daily close for a D swing), so a move during the period redraws nothing until it closes.
- Price leaves the leg (default): on the first swing-timeframe close beyond where the completed leg started. When the swing later confirms, only the label changes.
- One leg height beyond: on a swing-timeframe close a full leg height past that point, so the old range stays longer and the profile can jump all at once when the next swing confirms.
- Never: always the last completed swing.
HOW TO USE IT
The profile maps where the latest swing traded heavily (POC, value area) and thinly (low-volume areas). Labels name the timeframe and the level ("D POC", "D SWING H", "D LVN") and merge when two levels share a price.
Colors mark the layer and the kind of level, never the side of price. The slow layer draws blue swing lines, a light blue POC and value area, yellow areas and a gray histogram; the fast layer uses purple, lavender and orange, with a purple histogram when that is turned on. No green or red is used. Swing lines are solid, the POC dotted, the value area dashed; line styles, widths, histogram color and histogram width can all be changed under Style.
Settings most people change:
- Slow swing timeframe (D by default): 4H for shorter legs, W for longer ones.
- Slow swing reversal (ATRs): higher gives fewer, larger swings.
- Fast swing: adds a 60m layer (off by default). Keep it below the slow timeframe.
- Switch to the swing in progress: how soon the profile moves on once price leaves the completed swing.
- Histograms: turn off to keep only the lines and areas.
On continuous futures (ES1!, MES1!) turn on back-adjustment, or a roll gap reads as a low-volume area. On stocks, set intraday charts to regular hours so they match the D chart.
REPAINTING AND DELAY
The calculation reads only completed source bars, so a reload, a settings change, bar replay and the live chart show the same thing, one source bar behind (5m, 15m, 60m, 4H or D). The bar before a session break shows at the next open. At or below the source timeframe the request uses lookahead on, and the function it evaluates reads only the previous source bar (high[1], low[1], close[1], volume[1], time[1]) plus whether a new swing period has started; that one-bar offset is what keeps lookahead from seeing the future. On a coarser chart the request uses lookahead off.
Exceptions:
- On charts whose bars don't nest in the source bars (such as 45m on 60m), the live chart and bar replay can show a new source bar one chart bar earlier than a reloaded chart does, on the last bar only.
- On regular-session stock charts whose last bar of the day starts before the last source bar (for a D swing: 39m, 44m, 49m to 51m, 56m to 59m), the layer sits one more source bar behind from the close to the next open.
- On stocks the data feed can report slightly different volume for live-built bars than for the same bars after a reload, so the POC or an area edge can move one row after a reload.
Levels change when a swing confirms, a LEG updates or an area fills. A swing confirms only after the k ATR reversal, but its lines and histogram start at the leg's first bar and its areas at the leg's last bar, so they cover bars on which the leg was not yet known. Only the current leg is kept: scrolled back, you see the current levels, not what showed at the time, so price can look as if it reacted to a level before the level existed.
LIMITS
- Only the latest leg per layer. No past profiles, developing POC, up/down volume split or alerts.
- Profiles use the last 5,000 source bars (for a D swing, 60m bars: about 714 regular-hours stock sessions, 217 futures sessions or 208 days on 24/7 markets). An older leg shows only its swing high and low, with a note.
- No swing confirms until 14 swing periods have completed, and a profile needs two confirmed swing points.
- Each layer calculates on at most the last 20,000 source bars; plans that load fewer can settle swings differently.
- Off when the chart timeframe is higher than the swing timeframe, on swings under 5m and on non-standard charts (Heikin Ashi, Renko and the like).
- Symbols without volume show the swing high and low only.
WHAT IT IS NOT
The swing high and low, POC and value area describe where the leg traded; they are not signals. Low-volume areas, shelves and the fill state are display aids. They have not been shown to give a trading edge, and the script makes no claim that price reacts at any level.
OPEN SOURCE
The source is published under the Mozilla Public License 2.0, so the request settings described above can be checked in the code.
For charting and study only. Not financial advice.

Tools for traders and investors smart enough to keep it simple 😘👌
➡️ SETUP SCREENER GUIDE: TheStratSuite.com/scanner/guide
🤑 TheStrat Suite is now FREE & open source: TheStratSuite.com
345strategies.com · github.com/345-strategies
➡️ SETUP SCREENER GUIDE: TheStratSuite.com/scanner/guide
🤑 TheStrat Suite is now FREE & open source: TheStratSuite.com
345strategies.com · github.com/345-strategies
면책사항
해당 정보와 게시물은 금융, 투자, 트레이딩 또는 기타 유형의 조언이나 권장 사항으로 간주되지 않으며, 트레이딩뷰에서 제공하거나 보증하는 것이 아닙니다. 자세한 내용은 이용 약관을 참조하세요.
Tools for traders and investors smart enough to keep it simple 😘👌
➡️ SETUP SCREENER GUIDE: TheStratSuite.com/scanner/guide
🤑 TheStrat Suite is now FREE & open source: TheStratSuite.com
345strategies.com · github.com/345-strategies
➡️ SETUP SCREENER GUIDE: TheStratSuite.com/scanner/guide
🤑 TheStrat Suite is now FREE & open source: TheStratSuite.com
345strategies.com · github.com/345-strategies
면책사항
해당 정보와 게시물은 금융, 투자, 트레이딩 또는 기타 유형의 조언이나 권장 사항으로 간주되지 않으며, 트레이딩뷰에서 제공하거나 보증하는 것이 아닙니다. 자세한 내용은 이용 약관을 참조하세요.