VolVol
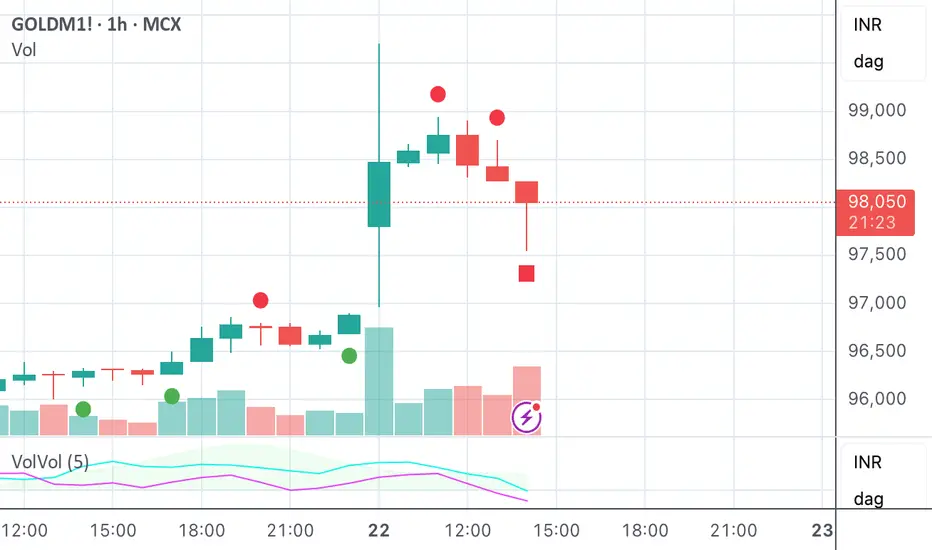
VolVol: Volatility & Volume
The indicator consists of 3 oscillating components that are all represented on a positive/negative percentage scale.
The indicator provides the following signals on the candlestick charts based on the above components' movements.
There may be simultaneous Bullish and Bearish signals. These should be treated as hedges for existing positions.
The indicator consists of 3 oscillating components that are all represented on a positive/negative percentage scale.
- Direction: Green/Red shaded area
Smoothened distance between Close and EMA of Close relative to StDev of Close - Intensity: Turquoise line
If direction = bullish: Smoothened distance between Low and EMA of Low relative to StDev of Low
If direction = bearish: Smoothened distance between High and EMA of High relative to StDev of High - Momentum: Fuchsia line
Double exponential average of bullish closing volume - bearish closing volume
The indicator provides the following signals on the candlestick charts based on the above components' movements.
- Bullish position signals: Below candles
- Bearish position signals: Above candles
- Entry signal [Circle]: Increase in all 3 factors or sharp increase in Intensity + Momentum
- Add signal [Triangle]: Trend slowdown because of volume drop or retracement following a temporary consolidation
- Exit signal [Square]: Increase in Intensity and Momentum against the prevailing trend direction
There may be simultaneous Bullish and Bearish signals. These should be treated as hedges for existing positions.

면책사항
해당 정보와 게시물은 금융, 투자, 트레이딩 또는 기타 유형의 조언이나 권장 사항으로 간주되지 않으며, 트레이딩뷰에서 제공하거나 보증하는 것이 아닙니다. 자세한 내용은 이용 약관을 참조하세요.
면책사항
해당 정보와 게시물은 금융, 투자, 트레이딩 또는 기타 유형의 조언이나 권장 사항으로 간주되지 않으며, 트레이딩뷰에서 제공하거나 보증하는 것이 아닙니다. 자세한 내용은 이용 약관을 참조하세요.