OPEN-SOURCE SCRIPT
Options Strikes
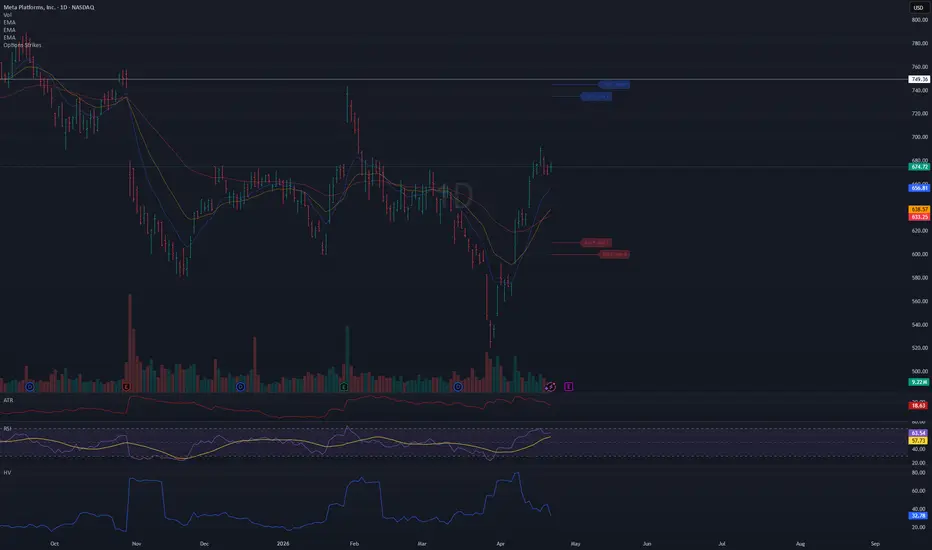
● Title: Options Strikes
Short description:
Visualize your open options positions on any chart — horizontal lines from entry to expiration, color-coded by Put/Call.
---
Full description:
Track up to 8 options contracts directly on your price chart. Each contract draws a horizontal line from your open date to the expiration date (4:00 PM ET), so you always see where your strikes sit relative to price and how much time is left.
Features
- Up to 8 contracts simultaneously — Put and Call
- Lines run from your open date to 4:00 PM ET on expiration day
- Puts in red, Calls in blue (colors and opacity customizable)
- Compact label at the end of each line: 610 P May 1
- Labels can be toggled on/off
- Calendar pickers for both Open date and Expiration date
- Auto-enable — a contract activates as soon as you enter a Strike value; set Strike to 0 to disable it
- Ticker filter — set a symbol (e.g. META) so lines only appear on that specific chart, useful when switching between
tickers
- Works on any symbol and any timeframe
How to use
1. Add the indicator to your chart
2. Open Settings → Inputs
3. For each contract: enter a Strike, select Type (Put/Call), pick Open date and Exp date
4. The line appears automatically — no need to toggle anything
5. Optionally set the Ticker field to lock this instance to a specific symbol
Tips
- Leave Ticker blank → lines show on every chart
- Open date defaults to today — change it only if you entered the position on a previous day
- To remove a contract, set its Strike back to 0
- Use contracts 5–8 for additional positions
- Adjust colors and line width in the Style group
Short description:
Visualize your open options positions on any chart — horizontal lines from entry to expiration, color-coded by Put/Call.
---
Full description:
Track up to 8 options contracts directly on your price chart. Each contract draws a horizontal line from your open date to the expiration date (4:00 PM ET), so you always see where your strikes sit relative to price and how much time is left.
Features
- Up to 8 contracts simultaneously — Put and Call
- Lines run from your open date to 4:00 PM ET on expiration day
- Puts in red, Calls in blue (colors and opacity customizable)
- Compact label at the end of each line: 610 P May 1
- Labels can be toggled on/off
- Calendar pickers for both Open date and Expiration date
- Auto-enable — a contract activates as soon as you enter a Strike value; set Strike to 0 to disable it
- Ticker filter — set a symbol (e.g. META) so lines only appear on that specific chart, useful when switching between
tickers
- Works on any symbol and any timeframe
How to use
1. Add the indicator to your chart
2. Open Settings → Inputs
3. For each contract: enter a Strike, select Type (Put/Call), pick Open date and Exp date
4. The line appears automatically — no need to toggle anything
5. Optionally set the Ticker field to lock this instance to a specific symbol
Tips
- Leave Ticker blank → lines show on every chart
- Open date defaults to today — change it only if you entered the position on a previous day
- To remove a contract, set its Strike back to 0
- Use contracts 5–8 for additional positions
- Adjust colors and line width in the Style group
오픈 소스 스크립트
트레이딩뷰의 진정한 정신에 따라, 이 스크립트의 작성자는 이를 오픈소스로 공개하여 트레이더들이 기능을 검토하고 검증할 수 있도록 했습니다. 작성자에게 찬사를 보냅니다! 이 코드는 무료로 사용할 수 있지만, 코드를 재게시하는 경우 하우스 룰이 적용된다는 점을 기억하세요.

면책사항
해당 정보와 게시물은 금융, 투자, 트레이딩 또는 기타 유형의 조언이나 권장 사항으로 간주되지 않으며, 트레이딩뷰에서 제공하거나 보증하는 것이 아닙니다. 자세한 내용은 이용 약관을 참조하세요.
오픈 소스 스크립트
트레이딩뷰의 진정한 정신에 따라, 이 스크립트의 작성자는 이를 오픈소스로 공개하여 트레이더들이 기능을 검토하고 검증할 수 있도록 했습니다. 작성자에게 찬사를 보냅니다! 이 코드는 무료로 사용할 수 있지만, 코드를 재게시하는 경우 하우스 룰이 적용된다는 점을 기억하세요.
면책사항
해당 정보와 게시물은 금융, 투자, 트레이딩 또는 기타 유형의 조언이나 권장 사항으로 간주되지 않으며, 트레이딩뷰에서 제공하거나 보증하는 것이 아닙니다. 자세한 내용은 이용 약관을 참조하세요.