OPEN-SOURCE SCRIPT
업데이트됨 AG Pro Premium Discount Zone Engine [AGPro Series]
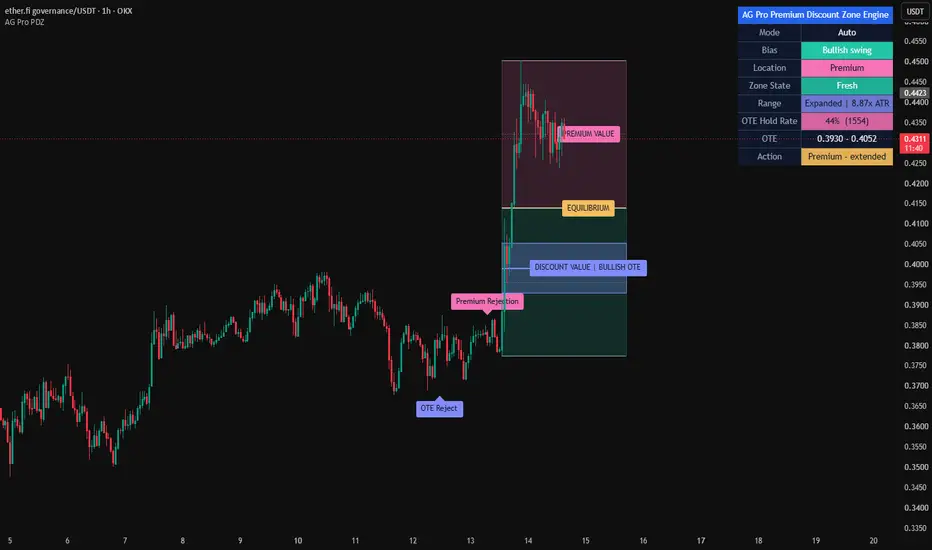
AG Pro Premium Discount Zone Engine [AGPro Series]
Overview / What it does
AG Pro Premium Discount Zone Engine is a dealing-range and retracement context overlay built to map relative value inside a selected swing. Instead of treating price as a sequence of isolated candles, the script frames current price location against an active high-low range and highlights where price is trading relative to equilibrium, premium, discount, and the OTE area.
The core purpose of this tool is organizational. It is designed to help traders read where price is positioned inside a live swing and how price reacts when it moves into higher-value or lower-value retracement zones. This is especially useful when a chart is moving inside a pullback, when trend continuation is being evaluated, or when users want to distinguish between shallow retracements and deeper repricing within an existing range.
The script supports multiple ways to define the active range. Users can work with an automatically detected swing, a higher-timeframe dealing range, or a manual-lite anchor mode based on bar offsets. Once a valid range is identified, the script projects premium and discount territory, marks the 50% equilibrium, and highlights the OTE area using the 61.8, 70.5, and 78.6 retracement levels.
The output is intentionally visual, structured, and restrained. Premium and discount zones are shown as clean value blocks. The OTE area is treated as the main focus zone rather than a minor detail. The panel summarizes the active bias, current location, zone state, equilibrium level, and OTE boundaries so that users can read the chart quickly without relying on aggressive signal language.
Unique Edge
What makes this script different is that it is not built as a market-structure detector, imbalance mapper, liquidity event scanner, or order-block locator. Its job is narrower and more specific: it organizes relative price location inside a defined dealing range.
That distinction matters. Many overlays attempt to explain everything on the chart at once. This script does not. It does not try to label breaks of structure, detect fair value gaps, mark liquidity sweeps, or classify institutional zones. Instead, it answers a more focused question: where is price trading inside the current swing, and how is it behaving as it enters or leaves important retracement territory?
This also separates the script from other AG Pro tools. Some AG Pro overlays are built around structure transitions, some around imbalance behavior, some around reaction quality, and some around event detection. AG Pro Premium Discount Zone Engine is built around valuation context. It does not compete with those tools directly. It complements them by adding a relative-value map around a selected range.
Another difference is the zone-state logic. The script does not stop at drawing premium and discount blocks. It also tracks how price interacts with the OTE area and classifies that interaction using a simple state model such as Fresh, First tap, Retested, Rejected, Accepted, and Invalidated. This creates a more contextual read than a static retracement overlay.
Methodology
The script begins by identifying an active swing range. In Auto Swing mode, it uses pivot-based range detection. In HTF Swing mode, it builds the range from a higher-timeframe high-low window. In Manual-Lite Swing mode, it uses bar-offset anchors to let the user define a practical swing reference without requiring manual drawing tools.
Once the active range is available, the script calculates the internal value map:
- Swing High
- Swing Low
- 50% Equilibrium
- Premium territory above equilibrium
- Discount territory below equilibrium
- OTE zone using 61.8, 70.5, and 78.6 retracement levels
The script then monitors how price behaves around those levels. This produces context states rather than directional promises. For example, price entering the OTE area is not treated the same as price rejecting from it, accepting beyond it, or invalidating the active range. These are intentionally different events because they describe different chart conditions.
The equilibrium level is included as a centerline reference, while the OTE band is given stronger visual emphasis. This helps distinguish broad valuation territory from the narrower retracement pocket that many users monitor more closely.
Signals & Alerts
The signals in this script are event-based and deterministic. They are not designed as standalone trade instructions. They are designed to describe interaction with the active range.
Available event logic includes:
- OTE Test
- OTE Reject
- OTE Accept
- Discount Reaction
- Premium Rejection
- Equilibrium Cross
- Range Invalidated
- OTE Failure
These events are intended to provide chart context. For example, an OTE Test simply means price entered the active OTE zone. A Premium Rejection means price traded into the premium side and closed back below the local premium threshold used by the script. A Discount Reaction means price interacted with the discount side and responded upward under the script's rules. These are context events, not guarantees of continuation.
Alerts follow the same philosophy. They are defined in a rules-based way so users can monitor range interaction without needing to watch the chart continuously. The alert layer is most useful when the script is used as a location filter inside a broader workflow.
Key Inputs
Swing mode
Lets the user choose between Auto Swing, HTF Swing, and Manual-Lite Swing depending on whether the goal is reactive automation, higher-timeframe framing, or a more controlled local range definition.
Auto pivot length
Controls how sensitive the pivot-based swing detection is in Auto mode.
HTF timeframe and HTF lookback
Used to define the broader dealing range in higher-timeframe mode.
Manual high bars back / manual low bars back
Used to create a manual-lite range by referencing earlier bars as anchors.
Render bars back / render bars forward
Controls how far the active range projection extends on the chart.
Zone opacity and theme
Used to refine the visual balance between premium, discount, and OTE areas.
Label controls
Used to reduce visual noise by controlling label cooldown, label render window, and maximum visible labels.
Panel controls
Allow the user to reposition the panel and adjust its text size to fit different chart layouts.
Limitations & Transparency
This script does not predict direction. It does not forecast reversals. It does not decide whether a chart should trend, break, or fail. It maps relative value inside a selected range and reports interaction events inside that framework.
The quality of the output depends on the quality of the active swing. If the selected or detected range is not meaningful for the user's workflow, the valuation map will also be less meaningful. This is especially important in highly compressed, extremely noisy, or structurally unclear conditions.
Auto Swing mode is practical, but like any automated swing model, it depends on pivot confirmation and may update as newer pivots become available. HTF mode provides broader context but may feel less reactive on smaller charts. Manual-Lite mode gives more control but still depends on the user choosing sensible anchor distances.
OTE logic is range-relative. It does not incorporate unrelated concepts such as order blocks, liquidity pools, fair value gaps, session models, or external structure classifications unless the user combines those ideas manually in a separate workflow.
This script is best understood as a valuation-context overlay. It is not a complete strategy, not a full decision engine, and not a substitute for risk management.
How this differs from other AG Pro scripts
AG Pro Premium Discount Zone Engine is intentionally not a structure-break tool, not a CHoCH/BOS detector, not a liquidity sweep scanner, not an FVG engine, and not an order-block mapper.
Its role inside the AG Pro family is to answer a different question:
Where is price trading inside the active dealing range, and what is the quality of its interaction with that value map?
That makes it particularly useful for users who already understand direction from another process and want cleaner execution context. In other words, some tools focus on structural change, some focus on imbalance, and some focus on reaction events. This one focuses on valuation location.
Risk Disclosure
This script is for chart analysis and educational use only. It does not provide financial advice, investment advice, or guaranteed trade signals. Any use of this tool should be combined with independent analysis, risk controls, position management, and market-specific judgment.
The presence of an alert, label, premium zone, discount zone, or OTE interaction does not imply that price must react in a specific way. Markets can continue, reverse, compress, or invalidate a range without warning. Users should treat this script as a context tool, not as a promise of outcome.
Overview / What it does
AG Pro Premium Discount Zone Engine is a dealing-range and retracement context overlay built to map relative value inside a selected swing. Instead of treating price as a sequence of isolated candles, the script frames current price location against an active high-low range and highlights where price is trading relative to equilibrium, premium, discount, and the OTE area.
The core purpose of this tool is organizational. It is designed to help traders read where price is positioned inside a live swing and how price reacts when it moves into higher-value or lower-value retracement zones. This is especially useful when a chart is moving inside a pullback, when trend continuation is being evaluated, or when users want to distinguish between shallow retracements and deeper repricing within an existing range.
The script supports multiple ways to define the active range. Users can work with an automatically detected swing, a higher-timeframe dealing range, or a manual-lite anchor mode based on bar offsets. Once a valid range is identified, the script projects premium and discount territory, marks the 50% equilibrium, and highlights the OTE area using the 61.8, 70.5, and 78.6 retracement levels.
The output is intentionally visual, structured, and restrained. Premium and discount zones are shown as clean value blocks. The OTE area is treated as the main focus zone rather than a minor detail. The panel summarizes the active bias, current location, zone state, equilibrium level, and OTE boundaries so that users can read the chart quickly without relying on aggressive signal language.
Unique Edge
What makes this script different is that it is not built as a market-structure detector, imbalance mapper, liquidity event scanner, or order-block locator. Its job is narrower and more specific: it organizes relative price location inside a defined dealing range.
That distinction matters. Many overlays attempt to explain everything on the chart at once. This script does not. It does not try to label breaks of structure, detect fair value gaps, mark liquidity sweeps, or classify institutional zones. Instead, it answers a more focused question: where is price trading inside the current swing, and how is it behaving as it enters or leaves important retracement territory?
This also separates the script from other AG Pro tools. Some AG Pro overlays are built around structure transitions, some around imbalance behavior, some around reaction quality, and some around event detection. AG Pro Premium Discount Zone Engine is built around valuation context. It does not compete with those tools directly. It complements them by adding a relative-value map around a selected range.
Another difference is the zone-state logic. The script does not stop at drawing premium and discount blocks. It also tracks how price interacts with the OTE area and classifies that interaction using a simple state model such as Fresh, First tap, Retested, Rejected, Accepted, and Invalidated. This creates a more contextual read than a static retracement overlay.
Methodology
The script begins by identifying an active swing range. In Auto Swing mode, it uses pivot-based range detection. In HTF Swing mode, it builds the range from a higher-timeframe high-low window. In Manual-Lite Swing mode, it uses bar-offset anchors to let the user define a practical swing reference without requiring manual drawing tools.
Once the active range is available, the script calculates the internal value map:
- Swing High
- Swing Low
- 50% Equilibrium
- Premium territory above equilibrium
- Discount territory below equilibrium
- OTE zone using 61.8, 70.5, and 78.6 retracement levels
The script then monitors how price behaves around those levels. This produces context states rather than directional promises. For example, price entering the OTE area is not treated the same as price rejecting from it, accepting beyond it, or invalidating the active range. These are intentionally different events because they describe different chart conditions.
The equilibrium level is included as a centerline reference, while the OTE band is given stronger visual emphasis. This helps distinguish broad valuation territory from the narrower retracement pocket that many users monitor more closely.
Signals & Alerts
The signals in this script are event-based and deterministic. They are not designed as standalone trade instructions. They are designed to describe interaction with the active range.
Available event logic includes:
- OTE Test
- OTE Reject
- OTE Accept
- Discount Reaction
- Premium Rejection
- Equilibrium Cross
- Range Invalidated
- OTE Failure
These events are intended to provide chart context. For example, an OTE Test simply means price entered the active OTE zone. A Premium Rejection means price traded into the premium side and closed back below the local premium threshold used by the script. A Discount Reaction means price interacted with the discount side and responded upward under the script's rules. These are context events, not guarantees of continuation.
Alerts follow the same philosophy. They are defined in a rules-based way so users can monitor range interaction without needing to watch the chart continuously. The alert layer is most useful when the script is used as a location filter inside a broader workflow.
Key Inputs
Swing mode
Lets the user choose between Auto Swing, HTF Swing, and Manual-Lite Swing depending on whether the goal is reactive automation, higher-timeframe framing, or a more controlled local range definition.
Auto pivot length
Controls how sensitive the pivot-based swing detection is in Auto mode.
HTF timeframe and HTF lookback
Used to define the broader dealing range in higher-timeframe mode.
Manual high bars back / manual low bars back
Used to create a manual-lite range by referencing earlier bars as anchors.
Render bars back / render bars forward
Controls how far the active range projection extends on the chart.
Zone opacity and theme
Used to refine the visual balance between premium, discount, and OTE areas.
Label controls
Used to reduce visual noise by controlling label cooldown, label render window, and maximum visible labels.
Panel controls
Allow the user to reposition the panel and adjust its text size to fit different chart layouts.
Limitations & Transparency
This script does not predict direction. It does not forecast reversals. It does not decide whether a chart should trend, break, or fail. It maps relative value inside a selected range and reports interaction events inside that framework.
The quality of the output depends on the quality of the active swing. If the selected or detected range is not meaningful for the user's workflow, the valuation map will also be less meaningful. This is especially important in highly compressed, extremely noisy, or structurally unclear conditions.
Auto Swing mode is practical, but like any automated swing model, it depends on pivot confirmation and may update as newer pivots become available. HTF mode provides broader context but may feel less reactive on smaller charts. Manual-Lite mode gives more control but still depends on the user choosing sensible anchor distances.
OTE logic is range-relative. It does not incorporate unrelated concepts such as order blocks, liquidity pools, fair value gaps, session models, or external structure classifications unless the user combines those ideas manually in a separate workflow.
This script is best understood as a valuation-context overlay. It is not a complete strategy, not a full decision engine, and not a substitute for risk management.
How this differs from other AG Pro scripts
AG Pro Premium Discount Zone Engine is intentionally not a structure-break tool, not a CHoCH/BOS detector, not a liquidity sweep scanner, not an FVG engine, and not an order-block mapper.
Its role inside the AG Pro family is to answer a different question:
Where is price trading inside the active dealing range, and what is the quality of its interaction with that value map?
That makes it particularly useful for users who already understand direction from another process and want cleaner execution context. In other words, some tools focus on structural change, some focus on imbalance, and some focus on reaction events. This one focuses on valuation location.
Risk Disclosure
This script is for chart analysis and educational use only. It does not provide financial advice, investment advice, or guaranteed trade signals. Any use of this tool should be combined with independent analysis, risk controls, position management, and market-specific judgment.
The presence of an alert, label, premium zone, discount zone, or OTE interaction does not imply that price must react in a specific way. Markets can continue, reverse, compress, or invalidate a range without warning. Users should treat this script as a context tool, not as a promise of outcome.
릴리즈 노트
Update Notes — V1.1This update refines the original Premium / Discount concept into a cleaner, more structured, and more readable execution model while preserving the script’s original purpose.
What changed in this update:
• Rebuilt the panel layout with the new AG Pro visual standard.
• Added a single merged blue header row with the script name for a cleaner and more premium presentation.
• Standardized the panel structure for faster reading during live chart analysis.
• Set the default panel font size to Small for a tighter and more elegant layout.
• Set label sizing to Normal by default for improved chart readability.
• Improved the active dealing range visualization.
• Refined Premium and Discount zone rendering so the chart stays cleaner while the key areas remain visible.
• Improved OTE zone presentation for better separation from the surrounding range.
• Added clearer internal structure inside the active range to make retracement context easier to interpret.
• Enhanced reaction labeling logic.
• Improved label placement so reaction tags sit more cleanly around candles.
• Reduced visual crowding during repeated tests and reactions.
• Preserved the important event logic while making the overall chart look calmer and more premium.
• Strengthened panel semantics and live state feedback.
• Improved live bias, location, and zone-state readability.
• Added range context information to help users quickly judge whether the current swing is relatively compressed or expanded.
• Preserved the script’s focus on contextual decision support rather than prediction.
• Improved overall chart hygiene.
• Better balance between visual presence and candle visibility.
• Cleaner spacing between labels, zones, and informational elements.
• More polished presentation aligned with the newer AG Pro public-free release standard.
What this update is intended to improve:
• Faster reading of Premium / Discount context.
• Better visibility of OTE interactions.
• Cleaner live chart experience.
• Stronger visual quality for public release and long-term usability.
Transparency:
This script remains a visual and contextual analysis tool. It does not predict future price movement and does not provide trade guarantees. Premium, Discount, Equilibrium, and OTE areas should always be interpreted with broader market structure and personal risk management.
릴리즈 노트
Update Notes - V1.2Premium Discount Zone Engine [AGPro Series] keeps the same published identity,
but this update makes the chart read faster, look more premium, and separate
the script more clearly from generic premium/discount overlays.
What changed in V1.2:
- Updated the public title format to the current AGPro standard:
Premium Discount Zone Engine [AGPro Series]
- Preserved AG Pro branding only in the panel header.
- Rebuilt the source header comment block with a cleaner publication-ready format.
- Refined the visual palette around the AGPro brand colors.
- Raised the default panel font size to Normal for better readability.
- Kept label font size at Normal and maintained moderate default label density.
- Added a new Rebalance Pocket layer between OTE and equilibrium.
- The Rebalance Pocket only activates after the first valid OTE interaction,
which keeps the chart informative without turning it into a generic box map.
- Added a stronger internal state sequence:
Fresh, First tap, Retested, Rebalancing, Recovered, Rejected, Accepted, Invalidated.
- Improved location semantics so the panel can distinguish:
Premium, Discount, Equilibrium, OTE, and Rebalance Pocket.
- Refined the active range anchor logic for HTF mode so the drawn range feels
more connected to the actual swing window.
- Tightened live label placement and kept cooldown / max-visible controls for
cleaner screenshots.
- Added a Value Recovery alert for equilibrium reclaim after an OTE response.
- Kept the script focused on single-swing valuation context rather than
liquidity sweeps, multi-timeframe value stacking, structure breaks, or
generic support/resistance classification.
Why this update should perform better visually:
- The chart now has one stronger focal path:
OTE -> Rebalance Pocket -> Equilibrium rotation
- The new pocket box gives the script a more memorable visual signature without
changing its original concept.
- The panel now reads more like a live execution context tool instead of a
static retracement map.
What stayed the same:
- The script is still a dealing-range and retracement context overlay.
- Premium, Discount, Equilibrium, and OTE remain the core framework.
- Auto Swing, HTF Swing, and Manual-Lite modes remain available.
- The tool remains disciplined and chart-clean instead of expanding into a full
smart-money suite.
Notes:
- This was a static Pine review only.
- Final compile validation should still be done in the TradingView editor
before publishing the update.
릴리즈 노트
🔧 UPDATE NOTES - v1.3This update focuses on chart readability and label spacing.
The core purpose of the script remains unchanged.
This release improves how the existing range, zone, and reaction logic is presented on the chart.
This script continues to function as an analytical and visualization tool.
It does not attempt to predict price direction or provide guaranteed outcomes.
------------------------
What Changed
------------------------
- Cleaner label spacing
A new minimum-gap control keeps any two on-chart labels from clustering in a tight area, regardless of their type. Reaction labels that previously overlapped when several events fired close together now stay readable.
- Adjustable density
The new spacing is fully adjustable, so the chart can be kept clean or made more detailed depending on preference.
------------------------
Visual Improvements
------------------------
- Reduced visual clutter to enhance first-glance interpretation
- Refined label spacing so overlapping reaction tags no longer stack on top of each other
- Preserved the existing premium, discount, OTE, and rebalance zone styling
- Kept the existing color palette and summary panel unchanged
------------------------
Interface & Usability
------------------------
- Added a single adjustable spacing control for on-chart labels
- Preserved all existing inputs, themes, and toggles
- Improved on-chart readability without changing core logic
------------------------
Behavior Notes
------------------------
This update does not change the core analytical logic of the script.
The swing detection, dealing-range valuation, OTE and rebalance logic, zone-state engine, and the summary panel all behave exactly as before.
Users should interpret outputs the same way as before, with cleaner label spacing on the chart.
------------------------
Limitations Reminder
------------------------
The script remains a rule-based analytical and visualization tool.
Market conditions such as volatility, liquidity, and timeframe differences may affect how zones and reactions appear.
Outputs should always be interpreted within broader market context.
------------------------
Risk Reminder
------------------------
This script is for educational and analytical purposes only.
It does not provide financial advice or guaranteed trading outcomes.
Users remain responsible for their own decisions.
릴리즈 노트
🔧 UPDATE NOTES - v1.4This update focuses on readability, decision clarity, and follow-through transparency.
The core purpose of the script remains unchanged.
This release improves how the existing premium, discount, and OTE logic is presented and interpreted on the chart, and adds an OTE Hold Rate so the active OTE zone can be reviewed against its own history.
This script continues to function as an analytical and visualization tool.
It does not attempt to predict price direction or provide guaranteed outcomes.
------------------------
What Changed
------------------------
• New OTE Hold Rate row (proof)
A new panel row reports how often past OTE entries rotated back through equilibrium (held) before price closed through the OTE zone or the range was invalidated (failed). It is evaluated only on confirmed bars, the previous case is resolved before a new one opens, entries that do not resolve within the proof window are left uncounted, and the value reads "Building (n)" until at least 6 samples exist. The number is color-graded by tier.
• New Action read
The panel now ends with an Action read that summarizes value location and zone state in one line: in OTE, value recovered, OTE failed, at equilibrium, in pocket, discount value, premium value, extended, or range lost. It is descriptive and intended to guide interpretation, not to instruct trades.
• Streamlined panel
The separate Pocket row was removed because its information overlapped with Zone State. The panel now reads Mode, Bias, Location, Zone State, Range, OTE Hold Rate, OTE, and Action as a single top-to-bottom summary.
• Adaptive text contrast on every badge and label
On-chart reaction labels, the live OTE label, and panel value cells now choose dark or light text automatically based on the badge color, so indigo OTE, pink premium, and gold equilibrium badges stay legible at a glance.
• Cleaner label spacing
At most one event label is now printed per bar, the minimum distance between any two on-chart labels was increased, and the vertical label offset was raised, so reaction tags no longer overlap when several events land close together and sit further from the candles.
------------------------
Visual Improvements
------------------------
• Improved chart readability with contrast-aware text on every label and badge.
• Reduced visual clutter by spacing reaction labels further apart and removing the redundant Pocket row.
• Refined visual hierarchy so location, zone state, and the Action read stand out clearly.
• Adjusted label positioning to keep tags off the candle bodies.
------------------------
Interface & Usability
------------------------
• Optimized the panel into a single decision summary ending with an Action read.
• Improved label and panel legibility with automatic text color.
• Adjusted default label spacing for a more balanced appearance.
• Enhanced overall user experience without changing the core dealing-range logic.
------------------------
Behavior Notes
------------------------
This update does not change the core analytical logic of the script.
Swing detection, equilibrium, premium, discount, OTE, pocket, and the zone-state machine work as before. The OTE Hold Rate and Action read are descriptive summaries layered on top of the existing engine.
Users should interpret outputs the same way as before, now with improved visual structure and added context.
------------------------
Limitations Reminder
------------------------
The script remains a rule-based analytical tool.
Market conditions such as volatility, liquidity, and timeframe differences may affect how zones, reactions, and the OTE Hold Rate appear. The OTE Hold Rate reflects only the OTE entries seen in the loaded history on the current symbol and timeframe and will vary between instruments and chart settings.
Outputs should always be interpreted within broader market context.
------------------------
Risk Reminder
------------------------
This script is for educational and analytical purposes only.
It does not provide financial advice or guaranteed trading outcomes.
Users remain responsible for their own decisions.
릴리즈 노트
Version 1.6 - Collision-Safe Value Identity LanesThis release removes the visible badge superposition around the active dealing range while preserving swing selection, value levels, OTE calculations, state transitions, proof sampling, and alert behavior.
• Moved active value identities into a font-aware forward lane inside the projected range, keeping them clear of the latest candle cluster.
• Consolidated overlapping parent and child identities into one OTE badge: DISCOUNT VALUE | BULLISH OTE or PREMIUM VALUE | BEARISH OTE.
• Staggered the active Rebalance Pocket into a secondary internal lane when it shares the same price neighborhood as OTE and equilibrium.
• Removed historical OTE Test and OTE Accept chart badges because the persistent OTE identity already communicates that context; their calculations remain available and the existing alert set is unchanged.
• Increased the default event-label ATR offset and spacing while reducing visible reaction history to four badges.
• Extended the default forward range from 18 to 26 bars to reserve clean identity space without adding target rails or prediction paths.
오픈 소스 스크립트
트레이딩뷰의 진정한 정신에 따라, 이 스크립트의 작성자는 이를 오픈소스로 공개하여 트레이더들이 기능을 검토하고 검증할 수 있도록 했습니다. 작성자에게 찬사를 보냅니다! 이 코드는 무료로 사용할 수 있지만, 코드를 재게시하는 경우 하우스 룰이 적용된다는 점을 기억하세요.

Trading Suite | Flagship Workflow :
tradingview.com/script/XJmX3p98-Trading-Suite-AGPro-Series/
Crypto Setup Planner | Multi-Symbol Analysis :
tradingview.com/script/LgVRo7Ql-Crypto-Setup-Planner-AGPro-Series/
tradingview.com/script/XJmX3p98-Trading-Suite-AGPro-Series/
Crypto Setup Planner | Multi-Symbol Analysis :
tradingview.com/script/LgVRo7Ql-Crypto-Setup-Planner-AGPro-Series/
면책사항
해당 정보와 게시물은 금융, 투자, 트레이딩 또는 기타 유형의 조언이나 권장 사항으로 간주되지 않으며, 트레이딩뷰에서 제공하거나 보증하는 것이 아닙니다. 자세한 내용은 이용 약관을 참조하세요.
오픈 소스 스크립트
트레이딩뷰의 진정한 정신에 따라, 이 스크립트의 작성자는 이를 오픈소스로 공개하여 트레이더들이 기능을 검토하고 검증할 수 있도록 했습니다. 작성자에게 찬사를 보냅니다! 이 코드는 무료로 사용할 수 있지만, 코드를 재게시하는 경우 하우스 룰이 적용된다는 점을 기억하세요.
Trading Suite | Flagship Workflow :
tradingview.com/script/XJmX3p98-Trading-Suite-AGPro-Series/
Crypto Setup Planner | Multi-Symbol Analysis :
tradingview.com/script/LgVRo7Ql-Crypto-Setup-Planner-AGPro-Series/
tradingview.com/script/XJmX3p98-Trading-Suite-AGPro-Series/
Crypto Setup Planner | Multi-Symbol Analysis :
tradingview.com/script/LgVRo7Ql-Crypto-Setup-Planner-AGPro-Series/
면책사항
해당 정보와 게시물은 금융, 투자, 트레이딩 또는 기타 유형의 조언이나 권장 사항으로 간주되지 않으며, 트레이딩뷰에서 제공하거나 보증하는 것이 아닙니다. 자세한 내용은 이용 약관을 참조하세요.