업데이트됨
Support and Resistance Breakout Signals Pro [MarkitTick]
Get this and other exclusive indicators in MarkitTick
This indicator is part of MarkitTick's Paid Space. Subscribe for $43.75/month to use it on your charts along with the author's other exclusive indicators. You pay right on TradingView and get access straight away.
Explore MarkitTick💡 An advanced, all-in-one technical analysis suite engineered to identify high-probability breakout opportunities. By mapping dynamic market structures across multiple timeframes, this tool provides actionable insights through predictive analytics, intelligent gap detection, and institutional-grade breakout confirmations.
This is the professional version of the free indicator Support and Resistance Breakout Signals
✨ Originality and Utility
Traditional support and resistance tools often clutter the chart with static lines that become irrelevant as market conditions evolve.
This script distinguishes itself by dynamically managing active price levels, intelligently merging nearby zones to reduce noise, and implementing strict quality filters to ignore false breakouts.
Furthermore, it introduces a proprietary predictive analytics engine that scores the strength and probability of every breakout.
It analyzes momentum, volume anomalies, and multi-timeframe confluence to give you a definitive edge.
Whether you are a discretionary trader seeking confluence or an algorithmic systematic trader utilizing JSON webhooks, this indicator streamlines your workflow with extreme precision.
Unlike basic visual aids, this suite acts as a complete trading ecosystem that tracks its own win rate and profitability metrics internally.
🔬 Methodology and Concepts
The core mechanics rely on adaptive market structure mapping. The engine continuously scans for significant pivot formations to establish valid structural boundaries.
● Dynamic Breakout Detection
Instead of acting on mere wicks, the engine validates true breakouts using strict internal criteria.
It evaluates candle body closure percentages, true range expansion metrics, and volume surges.
This effectively filters out market noise and identifies genuine directional intent driven by large market participants.
● Multi-Timeframe Confluence
The system operates concurrently on both the current chart timeframe and a selected higher timeframe.
Signals can be explicitly filtered to only trigger when aligned with the overarching directional bias.
This macro-to-micro alignment significantly improves the statistical reliability of the generated setups.
● Smart Gap Mapping
The indicator systematically maps unfilled price voids across the chart.
These voids are categorized dynamically based on trend duration and relative volume spikes.
By identifying whether a gap is a breakaway, runaway, or exhaustion gap, traders are provided with key targets or hidden reversal zones.
● Garbage Collection and Data Optimization
To ensure optimal performance, the script utilizes an internal state-management system that cleans up expired zones, trims historical data points, and automatically removes signals that no longer hold structural significance.
🎨 Visual Guide

● Visualizing Support & Resistance: Box vs. Line Styles
Based on the provided script, the indicator offers traders two distinct visual modes to plot Support and Resistance (S/R) levels on the chart:
• Box Style (Zone Representation)
When the "Draw Style" input is set to "Box", the indicator plots S/R levels as shaded rectangular zones. These zones highlight a range of price activity rather than a single point, visually representing areas where buying or selling pressure is concentrated. This is useful for identifying broader rejection areas or congestion zones.
• Line Style (Fixed Level Representation)
When the "Draw Style" input is set to "Line", the indicator displays S/R levels as clear horizontal lines at specific price points. This style is ideal for traders looking for precise levels for entry, exit, or stop-loss orders, offering a cleaner chart layout focused on key inflection points.
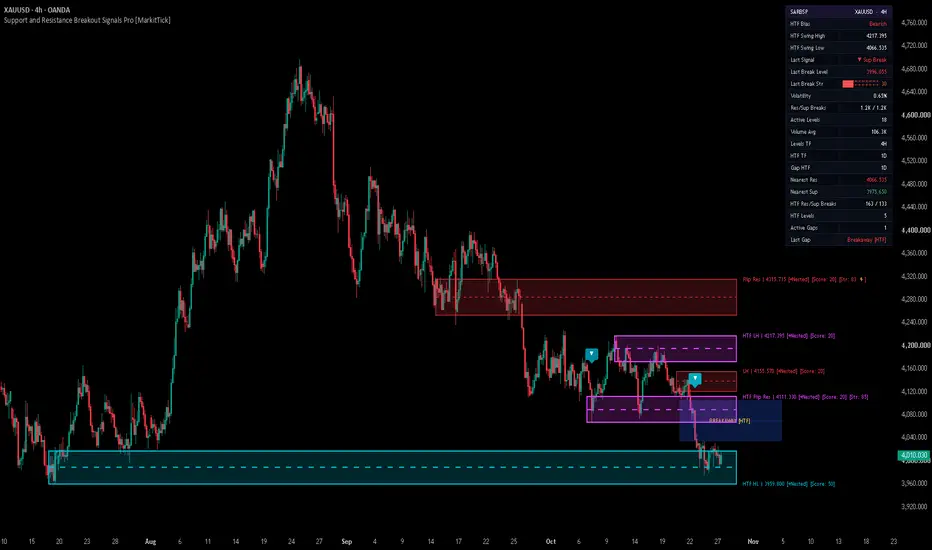
The chart outputs are meticulously designed for clarity and rapid interpretation without overwhelming the user.
● Price Zones and Lines
● Breakout Labels
● Gap Boxes
📖 How to Use
● S/R & Gap Confluence Logic


• "High-Probability Reversal Zones"
When a Price Gap occurs in alignment with a pre-identified Support or Resistance level, it creates a high-probability "Magnetic Zone." According to the indicator’s logic:
• Strategy Tip
Watch for price action signals when the market returns to these dual-confluence zones, as they often provide the most reliable entry points for institutional-grade setups.
Incorporating this tool into your daily routine is straightforward and highly effective.
● Trend Alignment
Utilize the Higher Timeframe levels to establish your daily or weekly directional bias.
Look for trade setups only when the current timeframe confirms a breakout in the direction of the larger trend.
● Signal Filtering
Pay close attention to the visual breakout labels.
A fully opaque label indicates a high-strength signal confirmed by volume and momentum.
Lighter, more transparent labels suggest lower conviction and may warrant tighter risk management or reduced position sizing.
● Target and Stop Placement
The indicator's dynamically drawn zones serve as highly logical areas for take-profits and stop-losses.
Anticipate price reactions when entering these shaded regions, and use historical gap boxes as secondary targets.
● Strategy Details and Risk Management
Never take every signal blindly. Use the built-in win-rate tracker to evaluate the asset's current behavior.
If the internal dashboard shows a low profit factor, wait for the market to transition from a ranging state to a trending state.
Ensure your stop-loss is placed beyond the nearest structural support or resistance to avoid premature stop-outs.
● Automated Execution
For algorithmic traders, configure the JSON webhook alerts to broadcast to your preferred execution platform, allowing you to trade these confirmed signals autonomously.
Note on Repainting: Due to the utilization of multi-timeframe historical data integration, higher timeframe structural levels may shift dynamically during intrabar formation until the higher timeframe candle achieves a definitive close.
●Practical trading example based on S/R analytics
• HTF HH | 5602.225 [+Nested] [Prob: 74%]

• HTF HH
Represents a Higher Timeframe Higher High, indicating a structural pivot point where the current high is greater than the previous high on the daily (or selected HTF) interval.
• 5602.225
Denotes the Precise Price Level of the identified resistance or support zone, formatted to the asset's minimum tick precision.
• [+Nested]
Indicates a Confluence Signal where multiple support or resistance levels from different timeframes or calculations overlap within the same price zone.
• [Prob: 74%]
A Predictive Analytics Score calculated based on HTF alignment, distance from current price (ATR), and historical win rate to estimate the probability of the level holding or breaking.
● Resistance Level Analysis [Prob: 74%]
When price approaches a identified resistance level, the 74% probability indicates a high statistical likelihood of rejection.
● Strategic Execution
⚙️ Inputs and Settings
The suite is highly customizable to fit any asset class or trading style.
● 1. Core Swing Logic
Define the specific lookback periods for both left and right bars to establish strict or loose pivot points based on your volatility preferences.
Control the maximum number of stored levels to keep the chart clean.
● 2. Higher Timeframe (HTF)
Enable HTF mapping, select the desired macro timeframe, and toggle the strict Confluence Filter to suppress counter-trend signals.
● 3. Breakout & Quality Filters
Toggle core constraints such as minimum body break percentages.
Require True Range expansion for signal validation.
Enable volume moving average confirmation and set time decay limits for aging levels.
● 4. Predictive Analytics
Individually toggle the internal scoring components.
Options include momentum strength, close positioning, volume anomalies, and historical win rate probability mapping.
● 5. Display & UI Controls
Customize how many active zones are displayed simultaneously.
Adjust zone transparency, line merging thresholds, and HTF visual thickness.
● 6. JSON Webhook Alerts
Enable webhooks and configure custom JSON payloads for long, short, close long, and close short commands.
Define specific True Range multipliers for automated dynamic stop-loss calculations.
● 7. Smart Gap Concepts
Enable current or higher timeframe gap mapping.
Adjust the minimum dimensional size for gap detection and set custom volume multipliers to accurately spot institutional involvement.
Set the trend maturity threshold to properly classify exhaustion gaps.
🔍 Deconstruction of the Underlying Scientific and Academic Framework
At a fundamental level, the indicator is constructed upon the principles of auction market theory, price discovery mechanisms, and statistical volatility dynamics.
● Auction Market Theory and Liquidity
The tool dynamically maps out historical liquidity pools by recognizing extreme pivot nodes.
When price approaches these established nodes, the auction process either finds equilibrium resulting in a rejection, or aggressively seeks new liquidity resulting in a valid breakout.
The internal engine abstracts the raw price data to assess this critical transition from balance to imbalance without relying on arbitrary moving averages.
● Volatility Expansion Dynamics
Built directly into the breakout logic is the mathematical concept of volatility cycles.
By integrating dynamically calculated true range parameters, the script differentiates between low-volatility baseline drift and high-volatility structural shifts.
This ensures signals are generated strictly during periods of statistical anomaly, capturing the true expansion phase of the asset.
● Heuristic Probability Scoring
The predictive analytics engine utilizes heuristic modeling to evaluate signal confidence.
By aggregating multiple independent market variables—such as relative volume surges, internal momentum metrics, and structural alignment—it computes a unified composite score.
This robust approach borrows heavily from multivariate analysis, substantially reducing the statistical weight of any single false positive variable.
● Adaptive Thresholding
Rather than relying on static percentages, the indicator measures breakout severity relative to the asset's immediate historical volatility.
This fluid thresholding means the tool naturally adapts to high-beta crypto markets as easily as it does to low-beta traditional forex pairs, maintaining mathematical integrity across environments.
⚠️ Disclaimer
All provided scripts and indicators are strictly for educational exploration and must not be interpreted as financial advice or a recommendation to execute trades. I expressly disclaim all liability for any financial losses or damages that may result, directly or indirectly, from the reliance on or application of these tools. Market participation carries inherent risk where past performance never guarantees future returns, leaving all investment decisions and due diligence solely at your own discretion.
This is the professional version of the free indicator Support and Resistance Breakout Signals
✨ Originality and Utility
Traditional support and resistance tools often clutter the chart with static lines that become irrelevant as market conditions evolve.
This script distinguishes itself by dynamically managing active price levels, intelligently merging nearby zones to reduce noise, and implementing strict quality filters to ignore false breakouts.
Furthermore, it introduces a proprietary predictive analytics engine that scores the strength and probability of every breakout.
It analyzes momentum, volume anomalies, and multi-timeframe confluence to give you a definitive edge.
Whether you are a discretionary trader seeking confluence or an algorithmic systematic trader utilizing JSON webhooks, this indicator streamlines your workflow with extreme precision.
Unlike basic visual aids, this suite acts as a complete trading ecosystem that tracks its own win rate and profitability metrics internally.
🔬 Methodology and Concepts
The core mechanics rely on adaptive market structure mapping. The engine continuously scans for significant pivot formations to establish valid structural boundaries.
● Dynamic Breakout Detection
Instead of acting on mere wicks, the engine validates true breakouts using strict internal criteria.
It evaluates candle body closure percentages, true range expansion metrics, and volume surges.
This effectively filters out market noise and identifies genuine directional intent driven by large market participants.
● Multi-Timeframe Confluence
The system operates concurrently on both the current chart timeframe and a selected higher timeframe.
Signals can be explicitly filtered to only trigger when aligned with the overarching directional bias.
This macro-to-micro alignment significantly improves the statistical reliability of the generated setups.
● Smart Gap Mapping
The indicator systematically maps unfilled price voids across the chart.
These voids are categorized dynamically based on trend duration and relative volume spikes.
By identifying whether a gap is a breakaway, runaway, or exhaustion gap, traders are provided with key targets or hidden reversal zones.
● Garbage Collection and Data Optimization
To ensure optimal performance, the script utilizes an internal state-management system that cleans up expired zones, trims historical data points, and automatically removes signals that no longer hold structural significance.
🎨 Visual Guide
● Visualizing Support & Resistance: Box vs. Line Styles
Based on the provided script, the indicator offers traders two distinct visual modes to plot Support and Resistance (S/R) levels on the chart:
• Box Style (Zone Representation)
When the "Draw Style" input is set to "Box", the indicator plots S/R levels as shaded rectangular zones. These zones highlight a range of price activity rather than a single point, visually representing areas where buying or selling pressure is concentrated. This is useful for identifying broader rejection areas or congestion zones.
• Line Style (Fixed Level Representation)
When the "Draw Style" input is set to "Line", the indicator displays S/R levels as clear horizontal lines at specific price points. This style is ideal for traders looking for precise levels for entry, exit, or stop-loss orders, offering a cleaner chart layout focused on key inflection points.
The chart outputs are meticulously designed for clarity and rapid interpretation without overwhelming the user.
● Price Zones and Lines
- Resistance Zones are highlighted with a translucent red background, visually representing supply areas.
- Support Zones feature a translucent green background, representing demand areas.
- Higher Timeframe levels utilize distinct colors, such as Fuchsia for Resistance and Aqua for Support.
- Thicker border lines are applied to higher timeframe zones to instantly differentiate them from local levels.
- Dashed mid-lines run through active zones to pinpoint the exact median of the active price structure.
● Breakout Labels
- Bullish Breakouts: Displayed as an upward-pointing triangle below the price action.
- Bearish Breakouts: Displayed as a downward-pointing triangle above the price action.
- Dynamic Transparency: The visual opacity of these icons dynamically adjusts based on the calculated strength of the breakout.
- Interactive Tooltips: Hovering over any breakout label reveals a detailed breakdown of the signal.
- Tooltip Data: Includes the number of broken levels, multi-break multipliers (indicated by a lightning bolt symbol), and the calculated probability score.
● Gap Boxes
- Extended visual boxes represent detected gaps in price action.
- Blue Boxes: Indicate Breakaway gaps, signaling the initiation of a new momentum phase.
- Orange Boxes: Indicate Runaway gaps, suggesting continuation and trend strength.
- Red Boxes: Indicate Exhaustion gaps, warning of potential trend fatigue and impending reversals.
📖 How to Use
● S/R & Gap Confluence Logic
• "High-Probability Reversal Zones"
When a Price Gap occurs in alignment with a pre-identified Support or Resistance level, it creates a high-probability "Magnetic Zone." According to the indicator’s logic:
- Gap-Level Confluence: If a gap opens or remains unfilled exactly at a key S/R level, the probability of the price returning to "fill the gap" or retest that specific level is significantly increased.
- Market Magnetism: These areas act as liquidity pools. When a breakout level coincides with a gap, the market often treats it as a primary target for a mean-reversion move before continuing the trend.
• Strategy Tip
Watch for price action signals when the market returns to these dual-confluence zones, as they often provide the most reliable entry points for institutional-grade setups.
Incorporating this tool into your daily routine is straightforward and highly effective.
● Trend Alignment
Utilize the Higher Timeframe levels to establish your daily or weekly directional bias.
Look for trade setups only when the current timeframe confirms a breakout in the direction of the larger trend.
● Signal Filtering
Pay close attention to the visual breakout labels.
A fully opaque label indicates a high-strength signal confirmed by volume and momentum.
Lighter, more transparent labels suggest lower conviction and may warrant tighter risk management or reduced position sizing.
● Target and Stop Placement
The indicator's dynamically drawn zones serve as highly logical areas for take-profits and stop-losses.
Anticipate price reactions when entering these shaded regions, and use historical gap boxes as secondary targets.
● Strategy Details and Risk Management
Never take every signal blindly. Use the built-in win-rate tracker to evaluate the asset's current behavior.
If the internal dashboard shows a low profit factor, wait for the market to transition from a ranging state to a trending state.
Ensure your stop-loss is placed beyond the nearest structural support or resistance to avoid premature stop-outs.
● Automated Execution
For algorithmic traders, configure the JSON webhook alerts to broadcast to your preferred execution platform, allowing you to trade these confirmed signals autonomously.
Note on Repainting: Due to the utilization of multi-timeframe historical data integration, higher timeframe structural levels may shift dynamically during intrabar formation until the higher timeframe candle achieves a definitive close.
●Practical trading example based on S/R analytics
• HTF HH | 5602.225 [+Nested] [Prob: 74%]
• HTF HH
Represents a Higher Timeframe Higher High, indicating a structural pivot point where the current high is greater than the previous high on the daily (or selected HTF) interval.
• 5602.225
Denotes the Precise Price Level of the identified resistance or support zone, formatted to the asset's minimum tick precision.
• [+Nested]
Indicates a Confluence Signal where multiple support or resistance levels from different timeframes or calculations overlap within the same price zone.
• [Prob: 74%]
A Predictive Analytics Score calculated based on HTF alignment, distance from current price (ATR), and historical win rate to estimate the probability of the level holding or breaking.
● Resistance Level Analysis [Prob: 74%]
When price approaches a identified resistance level, the 74% probability indicates a high statistical likelihood of rejection.
● Strategic Execution
- For Long Positions: Secure partial profits (Take Profit) as price nears the level to mitigate reversal risk.
- For Short Entries: Monitor for a confirmed rejection signal at the level before execution.
- Breakout Scenario: A strong move above this level suggests a high-conviction breakout rather than a "fakeout," confirming momentum shift.
⚙️ Inputs and Settings
The suite is highly customizable to fit any asset class or trading style.
● 1. Core Swing Logic
Define the specific lookback periods for both left and right bars to establish strict or loose pivot points based on your volatility preferences.
Control the maximum number of stored levels to keep the chart clean.
● 2. Higher Timeframe (HTF)
Enable HTF mapping, select the desired macro timeframe, and toggle the strict Confluence Filter to suppress counter-trend signals.
● 3. Breakout & Quality Filters
Toggle core constraints such as minimum body break percentages.
Require True Range expansion for signal validation.
Enable volume moving average confirmation and set time decay limits for aging levels.
● 4. Predictive Analytics
Individually toggle the internal scoring components.
Options include momentum strength, close positioning, volume anomalies, and historical win rate probability mapping.
● 5. Display & UI Controls
Customize how many active zones are displayed simultaneously.
Adjust zone transparency, line merging thresholds, and HTF visual thickness.
● 6. JSON Webhook Alerts
Enable webhooks and configure custom JSON payloads for long, short, close long, and close short commands.
Define specific True Range multipliers for automated dynamic stop-loss calculations.
● 7. Smart Gap Concepts
Enable current or higher timeframe gap mapping.
Adjust the minimum dimensional size for gap detection and set custom volume multipliers to accurately spot institutional involvement.
Set the trend maturity threshold to properly classify exhaustion gaps.
🔍 Deconstruction of the Underlying Scientific and Academic Framework
At a fundamental level, the indicator is constructed upon the principles of auction market theory, price discovery mechanisms, and statistical volatility dynamics.
● Auction Market Theory and Liquidity
The tool dynamically maps out historical liquidity pools by recognizing extreme pivot nodes.
When price approaches these established nodes, the auction process either finds equilibrium resulting in a rejection, or aggressively seeks new liquidity resulting in a valid breakout.
The internal engine abstracts the raw price data to assess this critical transition from balance to imbalance without relying on arbitrary moving averages.
● Volatility Expansion Dynamics
Built directly into the breakout logic is the mathematical concept of volatility cycles.
By integrating dynamically calculated true range parameters, the script differentiates between low-volatility baseline drift and high-volatility structural shifts.
This ensures signals are generated strictly during periods of statistical anomaly, capturing the true expansion phase of the asset.
● Heuristic Probability Scoring
The predictive analytics engine utilizes heuristic modeling to evaluate signal confidence.
By aggregating multiple independent market variables—such as relative volume surges, internal momentum metrics, and structural alignment—it computes a unified composite score.
This robust approach borrows heavily from multivariate analysis, substantially reducing the statistical weight of any single false positive variable.
● Adaptive Thresholding
Rather than relying on static percentages, the indicator measures breakout severity relative to the asset's immediate historical volatility.
This fluid thresholding means the tool naturally adapts to high-beta crypto markets as easily as it does to low-beta traditional forex pairs, maintaining mathematical integrity across environments.
⚠️ Disclaimer
All provided scripts and indicators are strictly for educational exploration and must not be interpreted as financial advice or a recommendation to execute trades. I expressly disclaim all liability for any financial losses or damages that may result, directly or indirectly, from the reliance on or application of these tools. Market participation carries inherent risk where past performance never guarantees future returns, leaving all investment decisions and due diligence solely at your own discretion.
릴리즈 노트
Improved script stability and resolved a potential crash on the initial bar.릴리즈 노트
Optimizing indicator performance and execution speed릴리즈 노트
Version Update SummaryNew Feature: Live Trade Levels Overlay
- When a breakout signal fires, the indicator can now draw the associated entry, stop-loss, and take-profit levels directly on the chart as extending lines.
- This gives traders an immediate, visual read of the trade structure behind every signal, without needing to calculate levels manually or cross-reference the alert feed.
- Three new line types appear on signal: an Entry line, a Stop-Loss line, and a Take-Profit line, each rendered in its own distinct color with a price label on the right edge.
- Two shaded zones are added between these lines: a risk zone connecting stop-loss to entry, and a reward zone connecting entry to take-profit, so the risk-to-reward relationship is visible at a glance.
How to Use: Live Trade Levels Overlay
- The Entry line marks the reference price at which the signal was confirmed; the Stop-Loss line marks the protective exit level; the Take-Profit line marks the target exit level.
- The shaded risk zone (between stop and entry) and reward zone (between entry and target) let you visually compare how much room is being risked versus how much room is being targeted — a wider reward zone relative to the risk zone suggests a more favorable trade skew, and vice versa.
- All three lines and their zones extend forward together and update automatically as new bars form, so the trade picture stays current until a new signal replaces it.
New Feature: Live Performance Dashboard
- A new on-chart dashboard summarizes the indicator's current market read and running performance statistics in one compact panel, positionable in any chart corner.
- This removes the need to mentally track breakout history or scroll back through past labels — the key stats are always visible at a glance.
- The dashboard includes: a header showing the symbol and timeframe; an HTF Bias row showing the prevailing higher-timeframe directional lean; a Last Signal row showing the most recent breakout direction; a Volatility row with a visual strength bar; a Profit Factor row with a visual strength bar; a Pending Trades row with a visual strength bar; a Resistance/Support Breaks counter; and an Active Levels counter.
How to Use: Live Performance Dashboard
- The HTF Bias row shows whether the higher timeframe structure is currently leaning bullish, bearish, or neutral — use this as a quick directional filter before acting on lower-timeframe signals.
- The Last Signal row shows the most recent breakout direction (long or short) so you can see at a glance which side the market last confirmed a move on.
- The Volatility and Profit Factor rows use a filled bar plus a color cue: bars filled further to the right and shaded toward green indicate stronger readings, while shorter, red-shaded bars indicate weaker readings. This lets you judge market conditions and the indicator's recent effectiveness without reading raw numbers.
- The Pending Trades bar reflects how many previously signaled trades are still awaiting resolution, giving a sense of how much unresolved exposure the indicator is currently tracking.
- The Resistance/Support Breaks and Active Levels counters give a running tally of confirmed structure breaks and how many support/resistance levels are currently being monitored, useful for gauging how active the current market structure is.
Enhancement: Webhook Payload Now Includes Trade Direction
- JSON webhook alerts now include an explicit direction field alongside the existing action, ticker, timeframe, entry, take-profit, and stop-loss fields, making automated trade routing more reliable downstream.
Enhancement: New Take-Profit Hit Alerts
- Two new alert conditions notify when an active long or short take-profit target is reached, in addition to the existing breakout and close alerts, giving fuller trade lifecycle coverage without manual monitoring.
Enhancement: Cleaner Alert Messaging
- All alert messages are now clearly branded and only fire on confirmed bar closes, reducing noise from intrabar repaint ticks and making alert logs easier to scan.
Refinement: Input Panel Reorganized
- Settings groups have been consolidated and given clearer icons and labels, making it faster to locate and adjust related options.
릴리즈 노트
MAJOR UPDATE — SIGNAL, ALERT AND LEVEL ACCURACY1. Unified Breakout Signalling Across Timeframes
When a standard level and a higher-timeframe level break on the same bar, the system now treats this as one single signal instead of several competing ones.
- One entry, one stop and one target per direction per bar, with higher-timeframe context taking precedence.
- The drawn trade levels, the alert payload and the performance ledger now always agree with each other.
- Opening a new signal in one direction automatically retires any still-armed target in the opposite direction.
2. Reliable Take-Profit and Exit Alerts
- Target-reached alerts now fire once, on a confirmed bar, and then stand down — they can no longer repeat on every later bar that revisits the same price.
- Position-close alerts now respond to any qualifying opposing break, including higher-timeframe breaks that were previously ignored.
- Exit alerts now carry the target price that was actually reached.
3. Webhook Payload Hardening
- Custom action text containing quotation marks or special characters no longer produces a malformed payload that a receiving platform would reject without warning.
- Missing target or stop values are now transmitted in a form every standard parser accepts.
- Webhook alerts are now blocked, with a clear on-screen explanation, on synthetic-price chart types (Heikin Ashi, Renko, Kagi, Point and Figure, Line Break and Range), where broadcast prices would never have traded.
4. Gap Zones — Dual-Timeframe Display
- A higher-timeframe gap and a chart-timeframe gap can now be displayed at the same time; previously the higher-timeframe zone silently erased the other.
- Higher-timeframe gap boxes now project forward in proportion to their own timeframe rather than the chart's, so their extension is visually correct on any chart.
- The number of simultaneously drawn gaps is now capped, preventing the older gaps from being dropped unpredictably on long histories.
5. Pivot and Level Detection Accuracy
- The Left Bars and Right Bars settings are now fully honoured on both the multi-timeframe and higher-timeframe level engines; asymmetric settings previously had no effect.
- Pivots now require a complete confirmation window on both sides before being accepted, removing premature levels near the start of a chart or after data gaps.
- Levels are now anchored to the exact bar that formed them, aligning zones and lines precisely with the swing they represent.
- Selecting a timeframe lower than the chart timeframe now safely falls back to the chart timeframe instead of returning misleading values.
- Repeated levels at an identical price on a higher timeframe are now registered correctly rather than being discarded.
6. Performance Dashboard Integrity
- Bars that touch both the target and the stop are no longer automatically scored as wins, removing a systematic upward bias in the displayed statistics.
- Only fully defined trades enter the tracking ledger, and the ledger is now bounded, keeping the dashboard responsive on long histories.
- The signal row now shows the most recent signal direction persistently instead of reverting to a neutral reading on the very next bar.
- The dashboard refreshes on the visible bar, so its readings always reflect the current state of the market.
Refinements
- Historical breakout markers are now concealed rather than destroyed when their level moves out of the active window, so genuine past signals reappear instead of being lost permanently.
- Support zone labels now display the defended price and its probability reading at the correct edge of the zone.
- Zone merging now respects a minimum sensible distance, so breakout markers can no longer disappear when merge sensitivity is set very low.
- Every zone is guaranteed a visible minimum thickness, preventing flat, unreadable boxes on tight ranges.
- Volatility and volume references now read the confirmed bar, keeping levels, stops and targets stable while the current bar is still forming.
- Volume confirmation is skipped gracefully on instruments that publish no volume data, instead of suppressing all signals.
- Higher-timeframe bias is now maintained whenever the confluence filter or the probability model requires it, even when higher-timeframe levels are hidden.
- Expansion and strength filters no longer produce claims during the warm-up period at the start of a chart.
- The Max Stored Levels setting is now bounded to a safe operating range.
- Dashboard strength bars now handle undefined values cleanly and can no longer render out-of-range readings.
- Zone, level and label rendering has been consolidated for smoother chart performance on dense histories.
릴리즈 노트
Support and Resistance Breakout Signals Pro — Update SummaryMajor Improvements
- Precise level anchoring on every timeframe — Levels and zones now start at the exact candle where the swing formed, including levels read through the Multi-Timeframe setting and from the HTF. Before, they could begin several bars away from the real swing.
- Break-event webhooks — JSON webhook alerts now describe the break itself: resistance or support, current timeframe or HTF, the break price and time, the broken level, the strength score and the current HTF bias. The payload no longer carries entry, target or stop values, and the custom action fields are retired. Automations built on the previous payload need to be updated.
- No more stops on non-standard charts — On Heikin Ashi, Renko, Kagi, Point & Figure, Line Break and Range charts the indicator now keeps running. Only the webhook is held back, because those charts show prices that never traded, and the dashboard reports it.
- Focused on structure, not trade management — The Entry, SL and TP drawings, the TP Long Hit and TP Short Hit alerts, and the historical trade statistics (Profit Factor, Pending Trades and the historical win-rate component) have been removed. Levels, zones, breakout signals and the four breakout alerts are unchanged in purpose.
New Features
- Expanded dashboard — Ten new rows give a full picture of the indicator at a glance: Skipped, Levels TF, HTF TF, Gap HTF, Nearest Res, Nearest Sup, HTF Res/Sup Breaks, HTF Levels, Active Gaps and Last Gap.
- Transparent skipped settings — A timeframe set lower than the chart's is replaced by the chart timeframe and named on the dashboard instead of being adjusted silently. A volume filter on a symbol with no volume data, and a webhook held back on a non-standard chart, are reported the same way.
- Tooltips on every setting — Each input now explains what it does directly in the settings panel.
- Progress-bar colours — New Bar High, Bar Mid and Bar Low colour settings control the dashboard progress bars.
Refinements
- Score replaces Prob — Level labels now read Score instead of Prob, making clear it is a point score rather than a measured probability.
- Sharper break-strength reading — The momentum strength component and the ATR Expansion Filter now capture the break candle's full movement more faithfully.
- Fairer volume handling — Bars with no volume no longer distort volume averages, and symbols without volume data no longer receive volume strength points.
- Clearer dashboard values — Last Signal now reads Res Break or Sup Break, timeframes use trader notation such as 1H or 1D, large counts are abbreviated, Active Levels shows how full the level set is, and an unknown HTF bias shows a dash.
- HTF bias always current — The HTF bias is now tracked at all times, so the dashboard and HTF-based scoring stay ready whichever features are switched on.
- Reorganised settings panel — HTF settings sit in a dedicated HTF Levels group together with Hide Current TF When HTF Active, the HTF Confluence Filter joins Quality Filters, and every gap setting, including Box Extension, is gathered in one Gaps group.
- Gap box text — Current-timeframe gap boxes now follow your Text Color setting, and HTF gap text is sized to match.
Performance
- Retiring trade tracking and skipping break checks on bars where no break can qualify reduce the work done on every bar, for faster loading on long histories.
How to Use
- Skipped — Lists any setting that could not be applied on this chart. None means everything is active.
- Levels TF, HTF TF and Gap HTF — The timeframe each feature is actually reading, or a dash when that feature is off.
- Nearest Res and Nearest Sup — The closest stored resistance above price and support below price, across current and HTF levels.
- HTF Res/Sup Breaks — Running count of HTF resistance and support breaks.
- HTF Levels and Active Levels — How full each stored level set is. The bar shifts from the Bar Low to the Bar High colour as it fills.
- Active Gaps — Gaps currently on the chart, with a note when older gaps were dropped to stay within capacity.
- Last Gap — The type of the most recent gap, in the support colour when bullish and the resistance colour when bearish.
Settings Reset Notice
This update reorganises the settings panel, so your saved settings for this indicator will return to their defaults. Please re-enter your preferred values after updating. Every setting outside the Core group is affected:
- HTF Levels — Enable HTF Levels, HTF Timeframe, HTF Left Bars, HTF Right Bars, HTF Max Levels, Hide Current TF When HTF Active
- Quality Filters — Enable Breakout Quality Filter, Min Body Break % (0–1), ATR Expansion Filter, Expansion ATR Length, Volume Confirmation, Volume MA Length, Enable Time Decay, Decay Period (Bars), Enable HTF Confluence Filter
- Analytics — Enable Predictive Analytics, Strength: Momentum/Range, Strength: Close Position, Strength: Volume Anomaly, Strength: Multi-Break Multiplier, Score: HTF Confluence, Score: Distance (ATR)
- Visuals — Levels To Display, Show All Levels, Lines Merge Threshold (% ATR), Max Break Labels, Enable Zone Mode (Boxes), Zone Transparency, HTF Line Width
- Gaps — Enable Current Timeframe Gaps, Enable Higher Timeframe Gaps, Higher Timeframe, Show Only Last Gap, Box Extension (Bars), Min Gap Size (Points), Structure Lookback Left, Structure Lookback Right, Volume Avg Length, Volume Spike Multiplier, Trend Maturity (Bars)
- Dashboard and Alerts — Show Dashboard, Position, Enable JSON Webhook Alerts
- Colors — LTF Resistance Color, LTF Support Color, Text Color, HTF Resistance Color, HTF Support Color, Resistance Zone Color, Support Zone Color, Breakaway Gap (Start), Runaway Gap (Middle), Exhaustion Gap (End), HTF Label Color, Dashboard BG, Dashboard Header, Dashboard Text
Retired settings: SL ATR Multiplier, Show Trade Levels, Prob: Historical Win Rate, the four webhook action fields, and SL, Entry and TP Level Color.
릴리즈 노트
Support and Resistance Breakout Signals Pro — Update SummaryMajor Improvements
- Signals on the breakout candle itself — break markers, alerts and webhook messages now fire at the close of the candle that actually broke the level, instead of on the candle after it. Levels, breaks and the HTF bias all settle on closed bars only, so nothing shifts while a candle is still forming.
- Cleaner flipped levels — once a broken level flips to the other side, it no longer produces repeat break signals back and forth. If price returns through a flipped level, that failed flip is cleared from the chart, cutting whipsaw noise around the same price.
- Fairer Strength readings — the Strength score now uses its full range whichever strength components you have switched on, and a component that has no data on a candle (for example volume on symbols without volume) is left out instead of dragging the reading down. When no component can be measured, Strength shows a dash rather than a misleading value.
- Zones stay visible while price is inside them — a support or resistance zone that price is currently trading within now remains on the chart instead of disappearing.
- Standard charts only — the indicator now runs on regular candle and bar charts. On Heikin Ashi, Renko, Kagi, Point & Figure, Range and Line Break charts, whose prices are synthetic, it shows a clear notice asking you to switch to Candles.
New Features
- Alert switches per level set — new Alert: Level Break and Alert: HTF Level Break settings let you mute current-timeframe or HTF break alerts separately. They apply to both the webhook and the standard alert conditions, while breaks are still detected and drawn.
- Fade Markers by Strength — an optional setting that draws strong breaks more solid and weaker breaks more faded, starting from the transparency of your chosen colour. Turn it off to draw markers exactly in your colours.
- Expanded dashboard — new rows for HTF Swing High, HTF Swing Low, Last Break Level and Last Break Str, plus live status rows for each active filter: Body Break, ATR Expansion, Volume Filter and HTF Confluence, and a Volume Avg row.
- Warning rows — skipped settings, capped level or gap counts, and gap classes unavailable on the current symbol are now highlighted, and these warnings stay visible even when the dashboard is hidden. A new Dashboard Warning colour controls their fill.
Refinements
- Strength & Score — Enable Predictive Analytics is now named Enable Strength & Score, and both values are shown as point scores rather than percentages, since they are ratings and not probabilities.
- Score without a known bias — the HTF component of the level Score is only counted once the HTF bias is established, so levels are no longer marked down before the bias is known.
- Consistent strength on multi-level breaks — when several levels break on the same candle, all of them now carry the same strength reading.
- Zone accuracy — each zone now always flips or clears together with its own level, even when a swing high and a swing low form on the same candle.
- Unified nested tag — merged levels show the same Nested tag in both line mode and zone mode.
- Smarter dashboard layout — rows appear only for the features you have switched on, Volatility is shown as a plain percentage, level and gap totals are shown as counts with a capped flag, tick charts display their timeframe correctly, and tooltips explain tick volume and the break-label limit.
- Webhook ready by default — Enable JSON Webhook Alerts is now on by default, and the message stays valid for every symbol and timeframe name.
- Reorganized settings panel — Quality Filters now sit directly under Core, Show Only Last Gap and Box Extension (Bars) moved to Visuals, and tooltips across the panel are clearer and more complete.
Performance
- Data for features that are switched off, such as hidden current-timeframe levels or disabled higher-timeframe gaps, is no longer requested, keeping the indicator lighter on the chart.
How to Use
- Faded markers — with Fade Markers by Strength on, a more solid marker means a stronger break; a paler one means a weaker break.
- HTF Swing High / HTF Swing Low — the latest confirmed higher-timeframe swing points behind the current HTF Bias.
- Last Break Level / Last Break Str — the price of the most recent broken level and the strength of that break, with the bar coloured from low to high strength.
- Filter rows — Pass in the Bar High colour means the filter is satisfied, Fail in the Bar Low colour means it is not, and a dash means no break has been seen yet.
- Highlighted rows and capped flag — a highlighted row is a warning that needs your attention; a count marked capped means the stored limit is full and the oldest entries are being dropped.
Settings Reset Notice
This update renames, moves and changes defaults in the settings panel, so your saved settings for this indicator will return to their defaults. Please re-enter your preferred values after updating. Affected settings:
- Quality Filters: Enable Breakout Quality Filter, Min Body Break % (0–1), ATR Expansion Filter, Expansion ATR Length, Volume Confirmation, Volume MA Length, Enable Time Decay, Decay Period (Bars), Enable HTF Confluence Filter
- HTF Levels: Enable HTF Levels, HTF Timeframe, HTF Left Bars, HTF Right Bars, HTF Max Levels, Hide Current TF When HTF Active
- Analytics: Enable Strength & Score
- Gaps: Enable Current Timeframe Gaps, Enable Higher Timeframe Gaps, Higher Timeframe, Min Gap Size (Points), Structure Lookback Left, Structure Lookback Right, Volume Avg Length, Volume Spike Multiplier, Trend Maturity (Bars)
- Visuals: Levels To Display, Show All Levels, Lines Merge Threshold (% ATR), Max Break Labels, Enable Zone Mode (Boxes), Zone Transparency, HTF Line Width, Show Only Last Gap, Box Extension (Bars)
- Dashboard: Show Dashboard, Position
- Alerts: Enable JSON Webhook Alerts
- Colors: LTF Resistance Color, LTF Support Color, Text Color, HTF Resistance Color, HTF Support Color, Resistance Zone Color, Support Zone Color, Breakaway Gap (Start), Runaway Gap (Middle), Exhaustion Gap (End), HTF Label Color, Dashboard BG, Dashboard Header, Dashboard Text, Bar High, Bar Mid, Bar Low

💡 Proprietary indicators. Original research. Built by analysts who trade.
📢 Free Telegram: t.me/MarkitTick_Updates
👑 Premium: TradingView Marketplace
📘 Guides: markittick.com
📢 Free Telegram: t.me/MarkitTick_Updates
👑 Premium: TradingView Marketplace
📘 Guides: markittick.com
면책사항
해당 정보와 게시물은 금융, 투자, 트레이딩 또는 기타 유형의 조언이나 권장 사항으로 간주되지 않으며, 트레이딩뷰에서 제공하거나 보증하는 것이 아닙니다. 자세한 내용은 이용 약관을 참조하세요.
💡 Proprietary indicators. Original research. Built by analysts who trade.
📢 Free Telegram: t.me/MarkitTick_Updates
👑 Premium: TradingView Marketplace
📘 Guides: markittick.com
📢 Free Telegram: t.me/MarkitTick_Updates
👑 Premium: TradingView Marketplace
📘 Guides: markittick.com
면책사항
해당 정보와 게시물은 금융, 투자, 트레이딩 또는 기타 유형의 조언이나 권장 사항으로 간주되지 않으며, 트레이딩뷰에서 제공하거나 보증하는 것이 아닙니다. 자세한 내용은 이용 약관을 참조하세요.