업데이트됨
Market Gravity [YinYangAlgorithms]
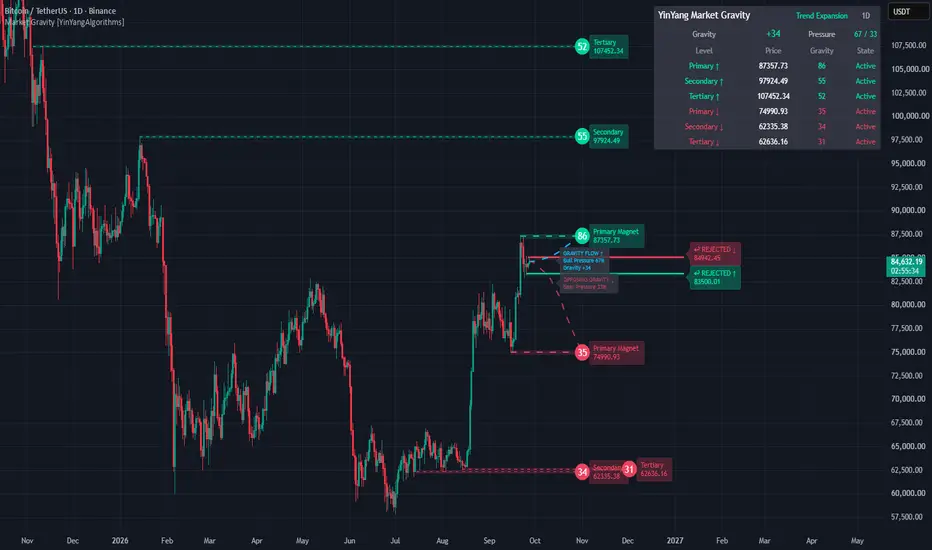
Market Gravity is an open-source liquidity-structure indicator built to help visualize where meaningful inferred liquidity may exist above and below price, and how the relative attraction toward those areas changes as market conditions evolve.
Instead of treating every swing high or low as equally important, Market Gravity builds liquidity pools from observable chart structure, evaluates their structural significance, and then adjusts their current relevance using factors such as distance, freshness, trend, and market regime.
The result is a map of ranked Liquidity Magnets above and below current price.
Each active magnet receives a Gravity Score from 0 to 100. That score represents the model’s current assessment of how relevant that liquidity zone is relative to other active zones.
The strongest magnets on both sides of price are then used to calculate Market Gravity and Bull/Bear Pressure.
The word “gravity” is used as a visual analogy for relative attraction. It does not mean price is guaranteed to move toward a level.
A Gravity Score is also not a probability. A score of 80 does not mean there is an 80% chance that price will reach that level.
Market Gravity does not have access to hidden orders or exchange order books. The liquidity shown by the indicator is inferred from observable price and volume structure.
🔶 OVERVIEW
Market Gravity separates two ideas that are often grouped together.
Liquidity Strength describes how significant a liquidity pool is structurally.
Gravity Score describes how relevant that pool is right now.
That distinction is important. A structurally important level can remain visible even when it is far away, while a nearer or better aligned level may temporarily receive a higher Gravity Score.
The indicator evaluates liquidity on both sides of price and can rank up to three active magnets per side (Above and Below Price):
The Primary Magnet is the highest-ranked active liquidity target on that side of price.
Market Gravity compares the combined attraction above and below price to calculate the current directional imbalance.
The curved Gravity paths provide a quick visual representation of that relationship. The dominant Gravity Flow points toward the stronger Primary Magnet, while the Opposing Gravity path shows the strongest competing magnet on the other side.
Each path also displays the Pressure associated with that side. The dominant path additionally displays Net Gravity when it is non-neutral.
🔶 FULL MARKET GRAVITY LAYOUT
The example below should show the indicator in a normal working state, with liquidity present on both sides of price.
Upper liquidity uses the default bullish color and lower liquidity uses the default bearish color. Circular markers show each level’s current Gravity Score.
The table in the top-right provides a more detailed view, including ranked magnets, prices, scores, lifecycle states, market regime, and directional pressure.
The Gravity Flow and Opposing Gravity paths provide the faster visual interpretation directly on the chart.

🔶 LIQUIDITY STRUCTURES
Market Gravity does not generate levels from arbitrary moving averages or fixed percentage distances.
Liquidity pools are built from observable market structure.
The model can use confirmed swing highs and lows, equal highs and lows, clustered swing structures, prominent isolated swings, completed previous-day highs and lows, completed previous-week highs and lows, and repeated rejection structures.
When compatible structures form close to one another, Market Gravity can combine them into a shared liquidity pool instead of displaying several nearly identical levels.
Clustering is normalized using ATR, which allows the permitted distance between structures to adapt to the volatility of the chart.
The indicator also tries to distinguish between independent structural evidence and repeated candles from the same local reaction. Several neighboring candles touching a similar area are not automatically counted as several separate liquidity events.
🔶 LIQUIDITY STRENGTH
Once a liquidity pool has been identified, Market Gravity assigns it a Liquidity Strength.
Liquidity Strength answers a simple question:
How significant is this liquidity structure based on the evidence that formed it?
This score describes the structure itself. It does not depend on whether price is currently moving toward or away from the level.
The model considers five main components:
🔹 1. Liquidity Density
How much compatible structural evidence contributes to the pool
🔹 2. Swing Prominence
How significant contributing swings are relative to volatility
🔹 3. Touch Quality
The quality of independent reactions associated with the pool
🔹 4. Timeframe Importance
Additional context from completed daily and weekly extremes
🔹 5. Formation Volume
A limited relative-volume contribution to the structure
Where appropriate, diminishing returns are used so that repeated similar touches cannot keep increasing structural strength indefinitely.
Liquidity Strength represents the underlying pool.
Gravity represents its current attraction.
🔶 GRAVITY SCORE
After Liquidity Strength has been established, Market Gravity calculates a dynamic Gravity Score.
At a high level, the score combines structural strength with current accessibility, freshness, trend context, and market regime.
Gravity Scores range from 0 to 100.
A higher score means the model currently considers that liquidity pool more relevant and accessible relative to competing liquidity.
It is not a probability or a performance measurement.
🔶 ACCESSIBILITY
Distance is normalized using ATR.
Nearby liquidity generally receives more current relevance than extremely distant liquidity, but the distance model is nonlinear. The closest possible level does not automatically become the strongest target just because it is nearest to price.
🔶 FRESHNESS
Liquidity structures gradually lose some current relevance as they age.
Market Gravity uses an exponential-style freshness model rather than simply removing every structure after a fixed number of bars.
Different structures can remain relevant for different lengths of time, and stronger pools can retain relevance longer than weaker ones.
🔶 TREND CONTEXT
Trend affects the relative attraction of upper and lower liquidity.
It does not create or remove liquidity structures.
The strength of this adjustment changes with the duration of the active chart timeframe. This allows custom intervals to receive a continuous timeframe-based value rather than relying on a handful of fixed timeframe names.
🔶 MARKET REGIME
Market Gravity also classifies the current environment into one of several broad regimes:
Trend Expansion, Trend, Range, and Compression.
Regime modifies the current Gravity calculation. It does not determine whether liquidity exists.
For example, directional liquidity can receive more relevance during trend expansion, while structures such as equal highs, equal lows, and repeated rejection areas may remain more meaningful in range conditions.
🔶 READING A BULLISH GRAVITY ENVIRONMENT
A bullish Market Gravity environment occurs when the combined attraction of ranked upper liquidity is greater than the attraction of ranked lower liquidity.
That does not mean the price has to move higher.
It simply means the current liquidity map is weighted more heavily toward the upper side.
The strongest upper pool becomes the Primary Magnet on that side, and the main Gravity Flow points toward it.
Lower liquidity remains visible because it still exists as a competing structure.
A bullish path badge may look like this:
Bull Pressure 60%
Gravity +25
Bull Pressure 60% means that 60% of the model’s current aggregate ranked pull is associated with upper liquidity.
Gravity +25 represents the current Net Gravity imbalance between upper and lower attraction.
The opposing path displays the Bear Pressure associated with the other side.

🔶 READING A BEARISH GRAVITY ENVIRONMENT
The same logic applies in the opposite direction.
When lower liquidity produces greater aggregate attraction than upper liquidity, Net Gravity becomes negative and the main Gravity Flow points toward the lower Primary Magnet.
Upper liquidity remains visible because opposing liquidity does not stop existing simply because the current imbalance favors the downside.
In a bearish environment, the dominant path displays Bear Pressure and the current negative Net Gravity value.

🔶 COMPETING AND BALANCED GRAVITY
Market Gravity is not always strongly directional.
There will be times when meaningful liquidity exists above and below price with relatively similar attraction.
When that happens, Net Gravity moves closer to neutral.
This simply means the model does not currently see a large imbalance between the strongest competing liquidity structures.
It should not be interpreted as a prediction that price will remain sideways.
Pressure remains visible on both paths during these conditions.
If rounded Net Gravity is exactly zero, the additional Gravity line is hidden rather than displaying Gravity +0 or Gravity -0.

🔶 PRIMARY, SECONDARY, AND TERTIARY MAGNETS
Market Gravity ranks active liquidity separately above and below price.
Primary is the strongest currently ranked magnet.
Secondary is the next-ranked active structure.
Tertiary is an additional meaningful competing structure.
Directional Market Gravity is not based on only one level.
The model combines the strongest ranked magnets on both sides, with progressively lower weighting for Secondary and Tertiary levels.
This allows the overall liquidity landscape to matter rather than allowing a single isolated score to represent the entire market.
When target prices sit close together, Market Gravity can move their labels horizontally to improve readability.
Only the label position changes. The actual liquidity price does not move.
🔶 MARKET GRAVITY AND PRESSURE
The top-right information table gives a more detailed summary of the current model.
The same directional measurements are also shown directly on the Gravity paths so users do not need to keep checking the table for basic context.
🔹 Gravity
Gravity represents Net Gravity, which measures the normalized imbalance between aggregate upper and lower attraction.
Its approximate range is:
-100 to 0 to +100
Positive values indicate greater aggregate upper attraction.
Negative values indicate greater aggregate lower attraction.
Values closer to zero indicate a more balanced liquidity environment.
When non-neutral, Net Gravity also appears on the dominant Gravity Flow badge.
For example:
Gravity +25
or:
Gravity -25
If rounded Net Gravity is exactly zero, this line is hidden.
🔹 Pressure
Pressure represents each side’s share of the model’s aggregate ranked pull.
For example, a 68 / 32 reading means approximately 68% of current ranked pull is associated with upper liquidity and 32% with lower liquidity.
On the chart, those values appear as:
Bull Pressure 68%
Bear Pressure 32%
These percentages describe relative model pull. They are not probabilities of future price direction.
🔹 Market Regime
The table also displays the currently detected market regime.
This provides additional context for how the Gravity model is interpreting the current environment.
🔹 Active Magnets
The table lists the Primary, Secondary, and Tertiary magnets above and below price, along with their price, Gravity Score, and lifecycle state.
Reading the Market Gravity table
The table is intended as a compact overview of the liquidity landscape.
Gravity shows the current directional imbalance.
Pressure shows how aggregate pull is distributed between the two sides.
The magnet rows show the individual structures contributing to that environment.
The path badges give the faster chart-level view, while the table provides more detail.

🔶 GRAVITY FLOW
The curved Gravity Flow connects current price with the model’s dominant Primary Magnet.
It is intended to make the current target hierarchy easier to understand without requiring users to manually compare every score.
The brighter cyan path points toward the Primary Magnet associated with the stronger directional pull.
The Opposing Gravity path points toward the strongest competing Primary Magnet on the other side.
Each path contains a small information badge.
The dominant path displays its direction, the Pressure associated with that side, and the current Net Gravity value when it is non-neutral.
For example:
GRAVITY FLOW ↑
Bull Pressure 60%
Gravity +25
The opposing path may display:
OPPOSING GRAVITY ↓
Bear Pressure 40%
Pressure describes each side’s relative share of aggregate ranked pull.
Gravity describes the imbalance between those two sides.
Neither measurement should be interpreted as the probability that price will move in a particular direction or reach a specific level.
🔶 AUTOMATIC BADGE PLACEMENT
Gravity path badges can move automatically when nearby chart elements would otherwise make them difficult to read.
The indicator considers nearby projection paths, liquidity structures, and other annotations when choosing a sensible placement.
The main Gravity Flow badge receives visual priority over the opposing badge.
This only affects presentation.
Moving a badge does not change its target, Pressure, Gravity value, path, or any underlying calculation.
The indicator also keeps the badge logically associated with its own path rather than moving it somewhere unrelated simply to avoid overlap.
🔶 THE CURVE IS NOT A PRICE FORECAST
The curve itself is only a visual connection between current price and the selected liquidity magnet.
It is not intended to show the expected shape, timing, velocity, or exact path of future candles.
Price does not need to follow the curve.
🔶 LIQUIDITY LIFECYCLE
Liquidity is not treated as permanently active.
Market Gravity tracks each qualified pool through a lifecycle so it can distinguish untouched liquidity from liquidity that price is currently interacting with or has already resolved:
🔹 1. Forming
Structure exists but has not yet reached the strength required for active ranking
🔹 2. Active
Qualified unswept liquidity is eligible for ranking
🔹 3. Approaching
Price has moved into the configured proximity region
🔹 4. Sweeping
Price has breached the outer liquidity boundary and the interaction has not yet resolved
🔹 5. Rejected
A sweep is followed by price closing back toward the original side before acceptance is established
🔹 6. Accepted
Confirmed closes establish price beyond the outer liquidity boundary
🔹 7. Retired
Resolved liquidity is removed from active future-target ranking
A simple touch can also be recorded as an event without permanently changing the lifecycle state.
🔶 APPROACHING AND SWEEPING LIQUIDITY
As price moves close to an active pool, its state can change from Active to Approaching.
If price then breaches the outer liquidity boundary far enough, the structure enters Sweeping.
These states help separate liquidity that remains ahead of price from liquidity that is actively being interacted with.

🔶 SWEEP REJECTION
A liquidity sweep does not necessarily mean price will continue through the level.
If price breaches the liquidity boundary but then closes back toward the original side before acceptance is established, Market Gravity can classify the interaction as Rejected.
This allows the indicator to distinguish between a temporary sweep and a move where price begins establishing beyond the liquidity zone.
A rejection classification describes what happened around that structure. It is not automatically a buy or sell signal.

🔶 LIQUIDITY ACCEPTANCE
If price moves beyond a liquidity zone and remains established beyond the outer boundary for the required confirmed closes, Market Gravity classifies the structure as Accepted.
Accepted liquidity is no longer treated as an unresolved future target.
After its short display period, the pool is removed from active ranking.
This prevents consumed structures from continuing to influence the current liquidity map as though they had never been interacted with.

🔶 CONFIRMED STRUCTURE AND HISTORICAL BEHAVIOUR
Some Market Gravity structures rely on confirmed swing pivots.
A pivot requires bars to form on both sides before it can be confirmed.
That means Market Gravity does not know a pivot exists at the exact moment the swing high or low first forms.
Once the pivot is confirmed, a liquidity line may visually extend back toward the original swing location for context.
Internally, however, the structure only becomes active from the point where it was actually confirmed.
This matters when reviewing historical charts.
Previous-day and previous-week structures also use completed periods rather than information from unfinished higher-timeframe candles.
🔶 SETTINGS
Market Gravity is designed to work with its default configuration, while advanced settings allow users to fine-tune how liquidity structures are detected, ranked, displayed, and alerted.
🔹 Advanced: Liquidity Detection
Pivot Left Bars and Pivot Right Bars control how much surrounding structure is required to confirm swing highs and lows.
Pool Cluster Distance controls how close compatible structures need to be before they can form the same liquidity pool.
Sweep Buffer controls how far price needs to move beyond a liquidity boundary before the interaction is classified as a sweep.
Maximum Liquidity Age, Maximum Stored Levels, and Maximum Target Distance provide practical limits for historical structures and chart resources.
🔹 Advanced: Liquidity Sources
Individual liquidity sources can be enabled or disabled.
These include swing high and low liquidity, equal highs and lows, major isolated swings, previous-day highs and lows, previous-week highs and lows, and repeated rejection structures.
Additional controls adjust tolerance, prominence, rejection separation, wick requirements, and recent pivot memory.
🔹 Advanced: Pool Engine
These settings control how independent reactions contribute to pools and how liquidity zones are constructed.
They include touch separation, clustered-pool padding, isolated-pool width, and maximum zone width.
🔹 Advanced: Gravity Model
These settings control volatility, trend, relative volume, accessibility, freshness, and proximity calculations.
The default model uses ATR-normalized accessibility and structure-dependent freshness decay.
Trend influence also adapts internally to the duration of the active chart timeframe.
🔹 Advanced: Liquidity Lifecycle
These settings control the minimum Liquidity Strength required for active ranking, the sweep rejection window, the number of confirmed closes required for Acceptance, and how long resolved lifecycle states remain visible.
🔹 Display: Projection
Show Gravity Paths controls the main Gravity Flow.
Show Opposing Gravity Path controls the competing path.
Projection Length changes the horizontal visual length of the curves.
It does not change the target price and should not be interpreted as a timing forecast.
The path badges display Pressure for each visible path. The dominant path also displays Net Gravity whenever the rounded value is non-neutral.
When automatic collision handling is enabled, these badges may move around nearby chart elements to improve readability.
🔹 Display
Users can control the number of displayed magnets, historical line length, level glow, the Market Gravity table, lifecycle annotations, collision handling, and table position.
The default table position is Top Right.
Automatic collision handling may adjust liquidity labels and Gravity badges when nearby visual elements would otherwise overlap.
These changes are visual only.
🔹 Alerts
Two configurable thresholds are available.
High Primary Gravity Threshold controls alerts for Primary Magnets reaching a specified Gravity Score.
Strong Net Gravity Threshold controls alerts for Market Gravity reaching a specified directional imbalance.
🔹 Style
Users can customize the default bullish liquidity color, bearish liquidity color, neutral Gravity color, and Primary Gravity Flow color.
🔶 ALERTS
Market Gravity includes confirmed-bar alerts covering target, lifecycle, and directional events.
Alert events are evaluated on confirmed bars so they remain consistent with the indicator’s confirmed lifecycle logic.
🔶 HOW MARKET GRAVITY DIFFERS FROM STANDARD SUPPORT AND RESISTANCE
Market Gravity is not simply drawing horizontal levels around recent highs and lows.
The main difference is that it separates structural liquidity from current attraction.
A liquidity pool can remain structurally important while its Gravity Score changes over time.
Multiple unresolved pools can also compete above and below price at the same time.
Market Gravity combines those structures into a directional model rather than requiring the user to interpret every level independently.
A simple way to think about the model is:
Liquidity Map → Structural Strength → Dynamic Gravity → Target Ranking → Directional Pressure → Liquidity Lifecycle
The relevance of a liquidity pool can change without changing the structural evidence that originally created it.
🔶 ORIGINALITY
Market Gravity combines several ideas into one liquidity-attraction framework while keeping their roles separate.
It identifies liquidity from multiple forms of confirmed market structure, groups compatible structures into ATR-normalized pools, separates structural Liquidity Strength from dynamic Gravity, applies nonlinear accessibility and freshness, ranks competing liquidity above and below price, and adjusts current relevance using trend and market regime.
The model then combines multiple ranked targets into directional Market Gravity, displays the dominant and opposing liquidity paths, shows side-specific Pressure directly on those paths, tracks Net Gravity, manages label placement, and follows each liquidity pool through its lifecycle.
The source code is published openly so anyone can inspect how the calculations are produced.
🔶 LIMITATIONS AND INTERPRETATION
Market Gravity is intended as a market-structure analysis tool, not as a standalone trading system.
The liquidity displayed by the indicator is inferred from chart structure. It is not direct order-book data and does not reveal hidden institutional orders or future orders.
Gravity Scores represent relative model attraction, not probabilities.
Pressure represents how the model’s aggregate ranked pull is distributed between upper and lower liquidity. A Bull Pressure reading of 70% does not mean there is a 70% chance that price will rise.
Net Gravity is an imbalance measurement. A reading such as Gravity +25 does not represent a 25% expected return, probability, or projected price move.
The Gravity Flow curve is a visualization connecting current price with the dominant liquidity target. It is not a forecast of the exact path future candles will take.
Badge placement also has no analytical meaning. Badges may move slightly to remain readable, but their position does not change the target or calculation they represent.
Confirmed pivots introduce confirmation delay. Swing-derived liquidity only becomes active once the required pivot structure has been confirmed.
Market structure also changes over time. New structures form, old structures are swept or accepted, distance changes, and trend or regime conditions can alter current Gravity Scores.
Different chart intervals can therefore produce different liquidity maps.
🔹 Market Gravity is best used as one source of market context alongside a trader’s broader analysis and risk-management process. 🔹
Instead of treating every swing high or low as equally important, Market Gravity builds liquidity pools from observable chart structure, evaluates their structural significance, and then adjusts their current relevance using factors such as distance, freshness, trend, and market regime.
The result is a map of ranked Liquidity Magnets above and below current price.
Each active magnet receives a Gravity Score from 0 to 100. That score represents the model’s current assessment of how relevant that liquidity zone is relative to other active zones.
The strongest magnets on both sides of price are then used to calculate Market Gravity and Bull/Bear Pressure.
The word “gravity” is used as a visual analogy for relative attraction. It does not mean price is guaranteed to move toward a level.
A Gravity Score is also not a probability. A score of 80 does not mean there is an 80% chance that price will reach that level.
Market Gravity does not have access to hidden orders or exchange order books. The liquidity shown by the indicator is inferred from observable price and volume structure.
🔶 OVERVIEW
Market Gravity separates two ideas that are often grouped together.
Liquidity Strength describes how significant a liquidity pool is structurally.
Gravity Score describes how relevant that pool is right now.
That distinction is important. A structurally important level can remain visible even when it is far away, while a nearer or better aligned level may temporarily receive a higher Gravity Score.
The indicator evaluates liquidity on both sides of price and can rank up to three active magnets per side (Above and Below Price):
- Primary Magnet
- Secondary Magnet
- Tertiary Magnet
The Primary Magnet is the highest-ranked active liquidity target on that side of price.
Market Gravity compares the combined attraction above and below price to calculate the current directional imbalance.
The curved Gravity paths provide a quick visual representation of that relationship. The dominant Gravity Flow points toward the stronger Primary Magnet, while the Opposing Gravity path shows the strongest competing magnet on the other side.
Each path also displays the Pressure associated with that side. The dominant path additionally displays Net Gravity when it is non-neutral.
🔶 FULL MARKET GRAVITY LAYOUT
The example below should show the indicator in a normal working state, with liquidity present on both sides of price.
Upper liquidity uses the default bullish color and lower liquidity uses the default bearish color. Circular markers show each level’s current Gravity Score.
The table in the top-right provides a more detailed view, including ranked magnets, prices, scores, lifecycle states, market regime, and directional pressure.
The Gravity Flow and Opposing Gravity paths provide the faster visual interpretation directly on the chart.
🔶 LIQUIDITY STRUCTURES
Market Gravity does not generate levels from arbitrary moving averages or fixed percentage distances.
Liquidity pools are built from observable market structure.
The model can use confirmed swing highs and lows, equal highs and lows, clustered swing structures, prominent isolated swings, completed previous-day highs and lows, completed previous-week highs and lows, and repeated rejection structures.
When compatible structures form close to one another, Market Gravity can combine them into a shared liquidity pool instead of displaying several nearly identical levels.
Clustering is normalized using ATR, which allows the permitted distance between structures to adapt to the volatility of the chart.
The indicator also tries to distinguish between independent structural evidence and repeated candles from the same local reaction. Several neighboring candles touching a similar area are not automatically counted as several separate liquidity events.
🔶 LIQUIDITY STRENGTH
Once a liquidity pool has been identified, Market Gravity assigns it a Liquidity Strength.
Liquidity Strength answers a simple question:
How significant is this liquidity structure based on the evidence that formed it?
This score describes the structure itself. It does not depend on whether price is currently moving toward or away from the level.
The model considers five main components:
🔹 1. Liquidity Density
How much compatible structural evidence contributes to the pool
🔹 2. Swing Prominence
How significant contributing swings are relative to volatility
🔹 3. Touch Quality
The quality of independent reactions associated with the pool
🔹 4. Timeframe Importance
Additional context from completed daily and weekly extremes
🔹 5. Formation Volume
A limited relative-volume contribution to the structure
Where appropriate, diminishing returns are used so that repeated similar touches cannot keep increasing structural strength indefinitely.
Liquidity Strength represents the underlying pool.
Gravity represents its current attraction.
🔶 GRAVITY SCORE
After Liquidity Strength has been established, Market Gravity calculates a dynamic Gravity Score.
At a high level, the score combines structural strength with current accessibility, freshness, trend context, and market regime.
Gravity Scores range from 0 to 100.
A higher score means the model currently considers that liquidity pool more relevant and accessible relative to competing liquidity.
It is not a probability or a performance measurement.
🔶 ACCESSIBILITY
Distance is normalized using ATR.
Nearby liquidity generally receives more current relevance than extremely distant liquidity, but the distance model is nonlinear. The closest possible level does not automatically become the strongest target just because it is nearest to price.
🔶 FRESHNESS
Liquidity structures gradually lose some current relevance as they age.
Market Gravity uses an exponential-style freshness model rather than simply removing every structure after a fixed number of bars.
Different structures can remain relevant for different lengths of time, and stronger pools can retain relevance longer than weaker ones.
🔶 TREND CONTEXT
Trend affects the relative attraction of upper and lower liquidity.
It does not create or remove liquidity structures.
The strength of this adjustment changes with the duration of the active chart timeframe. This allows custom intervals to receive a continuous timeframe-based value rather than relying on a handful of fixed timeframe names.
🔶 MARKET REGIME
Market Gravity also classifies the current environment into one of several broad regimes:
Trend Expansion, Trend, Range, and Compression.
Regime modifies the current Gravity calculation. It does not determine whether liquidity exists.
For example, directional liquidity can receive more relevance during trend expansion, while structures such as equal highs, equal lows, and repeated rejection areas may remain more meaningful in range conditions.
🔶 READING A BULLISH GRAVITY ENVIRONMENT
A bullish Market Gravity environment occurs when the combined attraction of ranked upper liquidity is greater than the attraction of ranked lower liquidity.
That does not mean the price has to move higher.
It simply means the current liquidity map is weighted more heavily toward the upper side.
The strongest upper pool becomes the Primary Magnet on that side, and the main Gravity Flow points toward it.
Lower liquidity remains visible because it still exists as a competing structure.
A bullish path badge may look like this:
Bull Pressure 60%
Gravity +25
Bull Pressure 60% means that 60% of the model’s current aggregate ranked pull is associated with upper liquidity.
Gravity +25 represents the current Net Gravity imbalance between upper and lower attraction.
The opposing path displays the Bear Pressure associated with the other side.
🔶 READING A BEARISH GRAVITY ENVIRONMENT
The same logic applies in the opposite direction.
When lower liquidity produces greater aggregate attraction than upper liquidity, Net Gravity becomes negative and the main Gravity Flow points toward the lower Primary Magnet.
Upper liquidity remains visible because opposing liquidity does not stop existing simply because the current imbalance favors the downside.
In a bearish environment, the dominant path displays Bear Pressure and the current negative Net Gravity value.
🔶 COMPETING AND BALANCED GRAVITY
Market Gravity is not always strongly directional.
There will be times when meaningful liquidity exists above and below price with relatively similar attraction.
When that happens, Net Gravity moves closer to neutral.
This simply means the model does not currently see a large imbalance between the strongest competing liquidity structures.
It should not be interpreted as a prediction that price will remain sideways.
Pressure remains visible on both paths during these conditions.
If rounded Net Gravity is exactly zero, the additional Gravity line is hidden rather than displaying Gravity +0 or Gravity -0.
🔶 PRIMARY, SECONDARY, AND TERTIARY MAGNETS
Market Gravity ranks active liquidity separately above and below price.
Primary is the strongest currently ranked magnet.
Secondary is the next-ranked active structure.
Tertiary is an additional meaningful competing structure.
Directional Market Gravity is not based on only one level.
The model combines the strongest ranked magnets on both sides, with progressively lower weighting for Secondary and Tertiary levels.
This allows the overall liquidity landscape to matter rather than allowing a single isolated score to represent the entire market.
When target prices sit close together, Market Gravity can move their labels horizontally to improve readability.
Only the label position changes. The actual liquidity price does not move.
🔶 MARKET GRAVITY AND PRESSURE
The top-right information table gives a more detailed summary of the current model.
The same directional measurements are also shown directly on the Gravity paths so users do not need to keep checking the table for basic context.
🔹 Gravity
Gravity represents Net Gravity, which measures the normalized imbalance between aggregate upper and lower attraction.
Its approximate range is:
-100 to 0 to +100
Positive values indicate greater aggregate upper attraction.
Negative values indicate greater aggregate lower attraction.
Values closer to zero indicate a more balanced liquidity environment.
When non-neutral, Net Gravity also appears on the dominant Gravity Flow badge.
For example:
Gravity +25
or:
Gravity -25
If rounded Net Gravity is exactly zero, this line is hidden.
🔹 Pressure
Pressure represents each side’s share of the model’s aggregate ranked pull.
For example, a 68 / 32 reading means approximately 68% of current ranked pull is associated with upper liquidity and 32% with lower liquidity.
On the chart, those values appear as:
Bull Pressure 68%
Bear Pressure 32%
These percentages describe relative model pull. They are not probabilities of future price direction.
🔹 Market Regime
The table also displays the currently detected market regime.
This provides additional context for how the Gravity model is interpreting the current environment.
🔹 Active Magnets
The table lists the Primary, Secondary, and Tertiary magnets above and below price, along with their price, Gravity Score, and lifecycle state.
Reading the Market Gravity table
The table is intended as a compact overview of the liquidity landscape.
Gravity shows the current directional imbalance.
Pressure shows how aggregate pull is distributed between the two sides.
The magnet rows show the individual structures contributing to that environment.
The path badges give the faster chart-level view, while the table provides more detail.
🔶 GRAVITY FLOW
The curved Gravity Flow connects current price with the model’s dominant Primary Magnet.
It is intended to make the current target hierarchy easier to understand without requiring users to manually compare every score.
The brighter cyan path points toward the Primary Magnet associated with the stronger directional pull.
The Opposing Gravity path points toward the strongest competing Primary Magnet on the other side.
Each path contains a small information badge.
The dominant path displays its direction, the Pressure associated with that side, and the current Net Gravity value when it is non-neutral.
For example:
GRAVITY FLOW ↑
Bull Pressure 60%
Gravity +25
The opposing path may display:
OPPOSING GRAVITY ↓
Bear Pressure 40%
Pressure describes each side’s relative share of aggregate ranked pull.
Gravity describes the imbalance between those two sides.
Neither measurement should be interpreted as the probability that price will move in a particular direction or reach a specific level.
🔶 AUTOMATIC BADGE PLACEMENT
Gravity path badges can move automatically when nearby chart elements would otherwise make them difficult to read.
The indicator considers nearby projection paths, liquidity structures, and other annotations when choosing a sensible placement.
The main Gravity Flow badge receives visual priority over the opposing badge.
This only affects presentation.
Moving a badge does not change its target, Pressure, Gravity value, path, or any underlying calculation.
The indicator also keeps the badge logically associated with its own path rather than moving it somewhere unrelated simply to avoid overlap.
🔶 THE CURVE IS NOT A PRICE FORECAST
The curve itself is only a visual connection between current price and the selected liquidity magnet.
It is not intended to show the expected shape, timing, velocity, or exact path of future candles.
Price does not need to follow the curve.
🔶 LIQUIDITY LIFECYCLE
Liquidity is not treated as permanently active.
Market Gravity tracks each qualified pool through a lifecycle so it can distinguish untouched liquidity from liquidity that price is currently interacting with or has already resolved:
🔹 1. Forming
Structure exists but has not yet reached the strength required for active ranking
🔹 2. Active
Qualified unswept liquidity is eligible for ranking
🔹 3. Approaching
Price has moved into the configured proximity region
🔹 4. Sweeping
Price has breached the outer liquidity boundary and the interaction has not yet resolved
🔹 5. Rejected
A sweep is followed by price closing back toward the original side before acceptance is established
🔹 6. Accepted
Confirmed closes establish price beyond the outer liquidity boundary
🔹 7. Retired
Resolved liquidity is removed from active future-target ranking
A simple touch can also be recorded as an event without permanently changing the lifecycle state.
🔶 APPROACHING AND SWEEPING LIQUIDITY
As price moves close to an active pool, its state can change from Active to Approaching.
If price then breaches the outer liquidity boundary far enough, the structure enters Sweeping.
These states help separate liquidity that remains ahead of price from liquidity that is actively being interacted with.
🔶 SWEEP REJECTION
A liquidity sweep does not necessarily mean price will continue through the level.
If price breaches the liquidity boundary but then closes back toward the original side before acceptance is established, Market Gravity can classify the interaction as Rejected.
This allows the indicator to distinguish between a temporary sweep and a move where price begins establishing beyond the liquidity zone.
A rejection classification describes what happened around that structure. It is not automatically a buy or sell signal.
🔶 LIQUIDITY ACCEPTANCE
If price moves beyond a liquidity zone and remains established beyond the outer boundary for the required confirmed closes, Market Gravity classifies the structure as Accepted.
Accepted liquidity is no longer treated as an unresolved future target.
After its short display period, the pool is removed from active ranking.
This prevents consumed structures from continuing to influence the current liquidity map as though they had never been interacted with.
🔶 CONFIRMED STRUCTURE AND HISTORICAL BEHAVIOUR
Some Market Gravity structures rely on confirmed swing pivots.
A pivot requires bars to form on both sides before it can be confirmed.
That means Market Gravity does not know a pivot exists at the exact moment the swing high or low first forms.
Once the pivot is confirmed, a liquidity line may visually extend back toward the original swing location for context.
Internally, however, the structure only becomes active from the point where it was actually confirmed.
This matters when reviewing historical charts.
Previous-day and previous-week structures also use completed periods rather than information from unfinished higher-timeframe candles.
🔶 SETTINGS
Market Gravity is designed to work with its default configuration, while advanced settings allow users to fine-tune how liquidity structures are detected, ranked, displayed, and alerted.
🔹 Advanced: Liquidity Detection
Pivot Left Bars and Pivot Right Bars control how much surrounding structure is required to confirm swing highs and lows.
Pool Cluster Distance controls how close compatible structures need to be before they can form the same liquidity pool.
Sweep Buffer controls how far price needs to move beyond a liquidity boundary before the interaction is classified as a sweep.
Maximum Liquidity Age, Maximum Stored Levels, and Maximum Target Distance provide practical limits for historical structures and chart resources.
🔹 Advanced: Liquidity Sources
Individual liquidity sources can be enabled or disabled.
These include swing high and low liquidity, equal highs and lows, major isolated swings, previous-day highs and lows, previous-week highs and lows, and repeated rejection structures.
Additional controls adjust tolerance, prominence, rejection separation, wick requirements, and recent pivot memory.
🔹 Advanced: Pool Engine
These settings control how independent reactions contribute to pools and how liquidity zones are constructed.
They include touch separation, clustered-pool padding, isolated-pool width, and maximum zone width.
🔹 Advanced: Gravity Model
These settings control volatility, trend, relative volume, accessibility, freshness, and proximity calculations.
The default model uses ATR-normalized accessibility and structure-dependent freshness decay.
Trend influence also adapts internally to the duration of the active chart timeframe.
🔹 Advanced: Liquidity Lifecycle
These settings control the minimum Liquidity Strength required for active ranking, the sweep rejection window, the number of confirmed closes required for Acceptance, and how long resolved lifecycle states remain visible.
🔹 Display: Projection
Show Gravity Paths controls the main Gravity Flow.
Show Opposing Gravity Path controls the competing path.
Projection Length changes the horizontal visual length of the curves.
It does not change the target price and should not be interpreted as a timing forecast.
The path badges display Pressure for each visible path. The dominant path also displays Net Gravity whenever the rounded value is non-neutral.
When automatic collision handling is enabled, these badges may move around nearby chart elements to improve readability.
🔹 Display
Users can control the number of displayed magnets, historical line length, level glow, the Market Gravity table, lifecycle annotations, collision handling, and table position.
The default table position is Top Right.
Automatic collision handling may adjust liquidity labels and Gravity badges when nearby visual elements would otherwise overlap.
These changes are visual only.
🔹 Alerts
Two configurable thresholds are available.
High Primary Gravity Threshold controls alerts for Primary Magnets reaching a specified Gravity Score.
Strong Net Gravity Threshold controls alerts for Market Gravity reaching a specified directional imbalance.
🔹 Style
Users can customize the default bullish liquidity color, bearish liquidity color, neutral Gravity color, and Primary Gravity Flow color.
🔶 ALERTS
Market Gravity includes confirmed-bar alerts covering target, lifecycle, and directional events.
- Primary Magnet Changed
- High Upside Primary Gravity
- High Downside Primary Gravity
- Upside Primary Magnet Approaching
- Downside Primary Magnet Approaching
- Upper Liquidity Swept
- Lower Liquidity Swept
- Upper Sweep Rejected
- Lower Sweep Rejected
- Upper Liquidity Accepted
- Lower Liquidity Accepted
- Net Gravity Flipped Bullish
- Net Gravity Flipped Bearish
- Strong Bullish Market Gravity
- Strong Bearish Market Gravity
Alert events are evaluated on confirmed bars so they remain consistent with the indicator’s confirmed lifecycle logic.
🔶 HOW MARKET GRAVITY DIFFERS FROM STANDARD SUPPORT AND RESISTANCE
Market Gravity is not simply drawing horizontal levels around recent highs and lows.
The main difference is that it separates structural liquidity from current attraction.
A liquidity pool can remain structurally important while its Gravity Score changes over time.
Multiple unresolved pools can also compete above and below price at the same time.
Market Gravity combines those structures into a directional model rather than requiring the user to interpret every level independently.
A simple way to think about the model is:
Liquidity Map → Structural Strength → Dynamic Gravity → Target Ranking → Directional Pressure → Liquidity Lifecycle
The relevance of a liquidity pool can change without changing the structural evidence that originally created it.
🔶 ORIGINALITY
Market Gravity combines several ideas into one liquidity-attraction framework while keeping their roles separate.
It identifies liquidity from multiple forms of confirmed market structure, groups compatible structures into ATR-normalized pools, separates structural Liquidity Strength from dynamic Gravity, applies nonlinear accessibility and freshness, ranks competing liquidity above and below price, and adjusts current relevance using trend and market regime.
The model then combines multiple ranked targets into directional Market Gravity, displays the dominant and opposing liquidity paths, shows side-specific Pressure directly on those paths, tracks Net Gravity, manages label placement, and follows each liquidity pool through its lifecycle.
The source code is published openly so anyone can inspect how the calculations are produced.
🔶 LIMITATIONS AND INTERPRETATION
Market Gravity is intended as a market-structure analysis tool, not as a standalone trading system.
The liquidity displayed by the indicator is inferred from chart structure. It is not direct order-book data and does not reveal hidden institutional orders or future orders.
Gravity Scores represent relative model attraction, not probabilities.
Pressure represents how the model’s aggregate ranked pull is distributed between upper and lower liquidity. A Bull Pressure reading of 70% does not mean there is a 70% chance that price will rise.
Net Gravity is an imbalance measurement. A reading such as Gravity +25 does not represent a 25% expected return, probability, or projected price move.
The Gravity Flow curve is a visualization connecting current price with the dominant liquidity target. It is not a forecast of the exact path future candles will take.
Badge placement also has no analytical meaning. Badges may move slightly to remain readable, but their position does not change the target or calculation they represent.
Confirmed pivots introduce confirmation delay. Swing-derived liquidity only becomes active once the required pivot structure has been confirmed.
Market structure also changes over time. New structures form, old structures are swept or accepted, distance changes, and trend or regime conditions can alter current Gravity Scores.
Different chart intervals can therefore produce different liquidity maps.
🔹 Market Gravity is best used as one source of market context alongside a trader’s broader analysis and risk-management process. 🔹
릴리즈 노트
Market Gravity – Readability & Display UpdateThis update focuses on improving chart readability and label presentation. The underlying Market Gravity calculations and liquidity model are unchanged.
TEXT SIZE & SCALING
- Increased the default text size for improved readability.
- Added a new Text Size (%) setting, allowing users to adjust Market Gravity text sizing to suit their chart and display.
- Target labels, Gravity Score values, lifecycle annotations, information-table text, and Gravity path badges now scale with this setting.
- Gravity Score circles remain compact so increasing text size does not unnecessarily enlarge the chart markers.
LABEL & SCORE PLACEMENT
- Improved Liquidity Magnet label spacing when multiple targets are positioned close together.
- Gravity Score values are now properly centered inside their circular markers.
- Removed redundant Active text from ranked target labels to reduce visual clutter. Other meaningful lifecycle states remain displayed when applicable.
- Improved lifecycle-event label placement around nearby liquidity levels.
GRAVITY PATH BADGES
- Improved spacing and collision handling for Gravity Flow and Opposing Gravity badges.
- Path badge text remains intentionally more compact relative to other chart labels to keep the projection area readable.
These changes are visual only and do not modify Liquidity Strength, Gravity Scores, target ranking, Market Gravity, Pressure, lifecycle calculations, or alert logic.

Free indicators, strategies & market analysis from YinYang Algorithms.
Website: YinYangAlgorithms.com
Community: discord.gg/ccEHem37FB
Website: YinYangAlgorithms.com
Community: discord.gg/ccEHem37FB
면책사항
해당 정보와 게시물은 금융, 투자, 트레이딩 또는 기타 유형의 조언이나 권장 사항으로 간주되지 않으며, 트레이딩뷰에서 제공하거나 보증하는 것이 아닙니다. 자세한 내용은 이용 약관을 참조하세요.
Free indicators, strategies & market analysis from YinYang Algorithms.
Website: YinYangAlgorithms.com
Community: discord.gg/ccEHem37FB
Website: YinYangAlgorithms.com
Community: discord.gg/ccEHem37FB
면책사항
해당 정보와 게시물은 금융, 투자, 트레이딩 또는 기타 유형의 조언이나 권장 사항으로 간주되지 않으며, 트레이딩뷰에서 제공하거나 보증하는 것이 아닙니다. 자세한 내용은 이용 약관을 참조하세요.