Volume Flow Analyzer with DMI Pressure Colors
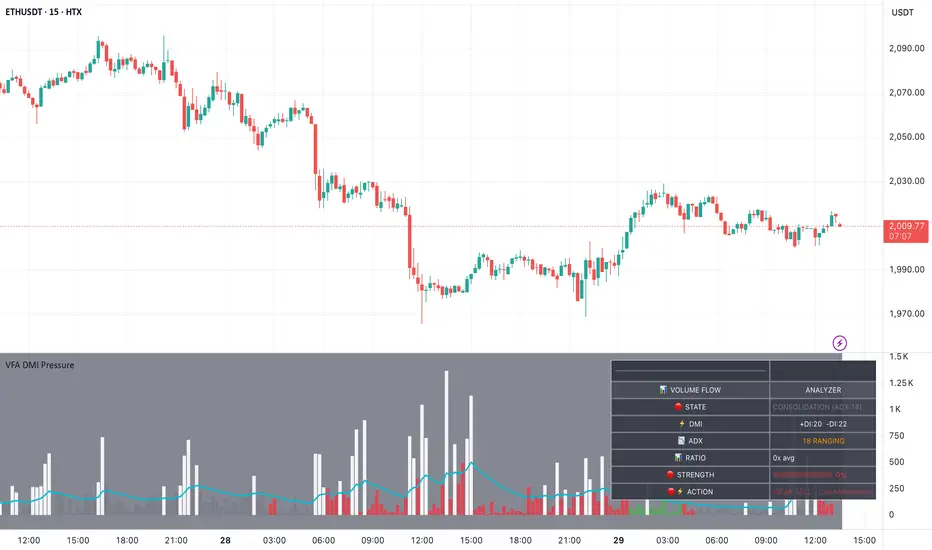
Author: IndicatorEdge** | Pine Script™ v6
What It Does
Colors volume bars GREEN (bullish) or RED (bearish) based on DMI pressure. Shows real-time trading suggestions in dashboard.
How It Works
- **+DI > -DI + ADX ≥ 20** → 🟢 BULLISH (buyers in control)
- **-DI > +DI + ADX ≥ 20** → 🔴 BEARISH (sellers in control)
- **+DI ≈ -DI or ADX < 20** → ⚪ NEUTRAL (wait)
Dashboard Info
| Field | Meaning |
|-------|---------|
| STATE | Bullish/Bearish/Neutral + ADX |
| DMI | +DI / -DI values (who's winning) |
| ADX | Trend strength (>20 = trending) |
| RATIO | Volume vs average (SPIKE = unusual) |
| STRENGTH | Visual bar █░░░ (0-100%) |
| ACTION | What to do (BUY/WAIT/SELL) |
Trading Actions
| When | Action |
|------|--------|
| +DI = -DI | ⏸️ WAIT - No direction |
| +DI > -DI + spike | 🟢🔥 STRONG BUY |
| +DI > -DI | 🟢 BUY |
| -DI > +DI + spike | 🔴🔥 STRONG SELL |
| -DI > +DI | 🔴 SELL |
| DMI crossover | 🟢⬆️ BULLISH ENTRY |
| DMI crossunder | 🔴⬇️ EXIT/SHORT |
How to Use
1. Check STATE (bullish/bearish)
2. Check ADX (>20 = strong trend)
3. Follow ACTION suggestion
4. Confirm with price action
Best Timeframes
15min, 30min, 1H, 4H
Alerts (6 types)
- Bullish crossover
- Bearish crossunder
- DMI equal (WAIT signal)
- Volume spike + bullish
- Volume spike + bearish
Limitations
- Lagging indicator (14 periods)
- Does NOT predict future
- False signals in low ADX
Default Settings
- DMI Period: 14
- ADX Threshold: 20
- ADX Filter: ON
- Bar Opacity: 80%
⚠️ Past performance does not guarantee future results. Confirmation with price action required.
What It Does
Colors volume bars GREEN (bullish) or RED (bearish) based on DMI pressure. Shows real-time trading suggestions in dashboard.
How It Works
- **+DI > -DI + ADX ≥ 20** → 🟢 BULLISH (buyers in control)
- **-DI > +DI + ADX ≥ 20** → 🔴 BEARISH (sellers in control)
- **+DI ≈ -DI or ADX < 20** → ⚪ NEUTRAL (wait)
Dashboard Info
| Field | Meaning |
|-------|---------|
| STATE | Bullish/Bearish/Neutral + ADX |
| DMI | +DI / -DI values (who's winning) |
| ADX | Trend strength (>20 = trending) |
| RATIO | Volume vs average (SPIKE = unusual) |
| STRENGTH | Visual bar █░░░ (0-100%) |
| ACTION | What to do (BUY/WAIT/SELL) |
Trading Actions
| When | Action |
|------|--------|
| +DI = -DI | ⏸️ WAIT - No direction |
| +DI > -DI + spike | 🟢🔥 STRONG BUY |
| +DI > -DI | 🟢 BUY |
| -DI > +DI + spike | 🔴🔥 STRONG SELL |
| -DI > +DI | 🔴 SELL |
| DMI crossover | 🟢⬆️ BULLISH ENTRY |
| DMI crossunder | 🔴⬇️ EXIT/SHORT |
How to Use
1. Check STATE (bullish/bearish)
2. Check ADX (>20 = strong trend)
3. Follow ACTION suggestion
4. Confirm with price action
Best Timeframes
15min, 30min, 1H, 4H
Alerts (6 types)
- Bullish crossover
- Bearish crossunder
- DMI equal (WAIT signal)
- Volume spike + bullish
- Volume spike + bearish
Limitations
- Lagging indicator (14 periods)
- Does NOT predict future
- False signals in low ADX
Default Settings
- DMI Period: 14
- ADX Threshold: 20
- ADX Filter: ON
- Bar Opacity: 80%
⚠️ Past performance does not guarantee future results. Confirmation with price action required.

📊 Turning data into clarity
📈 Crypto • Forex • Stocks
💡 Daily setups & indicator strategies
🔔 Join the #IndicatorEdge family
📈 Crypto • Forex • Stocks
💡 Daily setups & indicator strategies
🔔 Join the #IndicatorEdge family
면책사항
해당 정보와 게시물은 금융, 투자, 트레이딩 또는 기타 유형의 조언이나 권장 사항으로 간주되지 않으며, 트레이딩뷰에서 제공하거나 보증하는 것이 아닙니다. 자세한 내용은 이용 약관을 참조하세요.
📊 Turning data into clarity
📈 Crypto • Forex • Stocks
💡 Daily setups & indicator strategies
🔔 Join the #IndicatorEdge family
📈 Crypto • Forex • Stocks
💡 Daily setups & indicator strategies
🔔 Join the #IndicatorEdge family
면책사항
해당 정보와 게시물은 금융, 투자, 트레이딩 또는 기타 유형의 조언이나 권장 사항으로 간주되지 않으며, 트레이딩뷰에서 제공하거나 보증하는 것이 아닙니다. 자세한 내용은 이용 약관을 참조하세요.