OPEN-SOURCE SCRIPT
For Vietnamese: 3D Volume Weighted Liquidity Level
Introduction
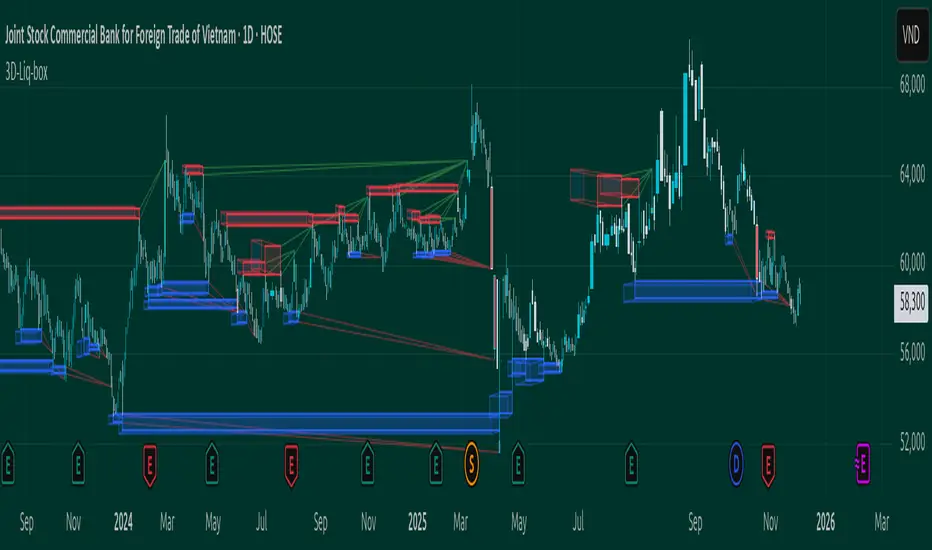
The 3D Volume Weighted Liquidity Level indicator visualizes market structure by identifying key support and resistance zones based on Pivot Highs and Lows. Unlike standard support/resistance lines, this tool adds a "3D" dimension by calculating the depth of the zone based on Accumulated Volume and Volatility (ATR). This helps traders visualize the "weighted" or significance of a specific price level.
Key Features
- 3D Visualization: Draws geometric boxes connecting similar Pivot points to create clear structural zones.
- Volume & Volatility Depth: The height (depth) of the box is not random. It is calculated dynamically using the accumulated volume between pivots multiplied by the ATR. Thicker boxes imply higher volume accumulation and volatility at that level.
- Liquidity Grab Detection: The indicator automatically detects and highlights bars that "grab liquidity" (break the top of a resistance box or the bottom of a support box), signaling potential stop hunts or reversals.
- Customizable Sensitivity: Users can adjust pivot lengths, search depth, and the volume scaling factor to fit different timeframes and assets.
How to Use
- Support & Resistance: Use the Blue Boxes as potential Support zones and Red Boxes as potential Resistance zones.
- Trend Reversals: Watch for the Liquidity Grab signals (colored bars). If price pierces a box but fails to close significantly beyond it, it often indicates a trap or a reversal setup.
- Volume Analysis: Pay attention to the thickness of the boxes. A thicker box suggests that a significant amount of volume was traded to form that structure, making it a stronger level of interest.
The 3D Volume Weighted Liquidity Level indicator visualizes market structure by identifying key support and resistance zones based on Pivot Highs and Lows. Unlike standard support/resistance lines, this tool adds a "3D" dimension by calculating the depth of the zone based on Accumulated Volume and Volatility (ATR). This helps traders visualize the "weighted" or significance of a specific price level.
Key Features
- 3D Visualization: Draws geometric boxes connecting similar Pivot points to create clear structural zones.
- Volume & Volatility Depth: The height (depth) of the box is not random. It is calculated dynamically using the accumulated volume between pivots multiplied by the ATR. Thicker boxes imply higher volume accumulation and volatility at that level.
- Liquidity Grab Detection: The indicator automatically detects and highlights bars that "grab liquidity" (break the top of a resistance box or the bottom of a support box), signaling potential stop hunts or reversals.
- Customizable Sensitivity: Users can adjust pivot lengths, search depth, and the volume scaling factor to fit different timeframes and assets.
How to Use
- Support & Resistance: Use the Blue Boxes as potential Support zones and Red Boxes as potential Resistance zones.
- Trend Reversals: Watch for the Liquidity Grab signals (colored bars). If price pierces a box but fails to close significantly beyond it, it often indicates a trap or a reversal setup.
- Volume Analysis: Pay attention to the thickness of the boxes. A thicker box suggests that a significant amount of volume was traded to form that structure, making it a stronger level of interest.
오픈 소스 스크립트
트레이딩뷰의 진정한 정신에 따라, 이 스크립트의 작성자는 이를 오픈소스로 공개하여 트레이더들이 기능을 검토하고 검증할 수 있도록 했습니다. 작성자에게 찬사를 보냅니다! 이 코드는 무료로 사용할 수 있지만, 코드를 재게시하는 경우 하우스 룰이 적용된다는 점을 기억하세요.

MikeJSaylor @ telegram
면책사항
해당 정보와 게시물은 금융, 투자, 트레이딩 또는 기타 유형의 조언이나 권장 사항으로 간주되지 않으며, 트레이딩뷰에서 제공하거나 보증하는 것이 아닙니다. 자세한 내용은 이용 약관을 참조하세요.
오픈 소스 스크립트
트레이딩뷰의 진정한 정신에 따라, 이 스크립트의 작성자는 이를 오픈소스로 공개하여 트레이더들이 기능을 검토하고 검증할 수 있도록 했습니다. 작성자에게 찬사를 보냅니다! 이 코드는 무료로 사용할 수 있지만, 코드를 재게시하는 경우 하우스 룰이 적용된다는 점을 기억하세요.
MikeJSaylor @ telegram
면책사항
해당 정보와 게시물은 금융, 투자, 트레이딩 또는 기타 유형의 조언이나 권장 사항으로 간주되지 않으며, 트레이딩뷰에서 제공하거나 보증하는 것이 아닙니다. 자세한 내용은 이용 약관을 참조하세요.