OPEN-SOURCE SCRIPT
업데이트됨 MJ Automatic Support and Resistance
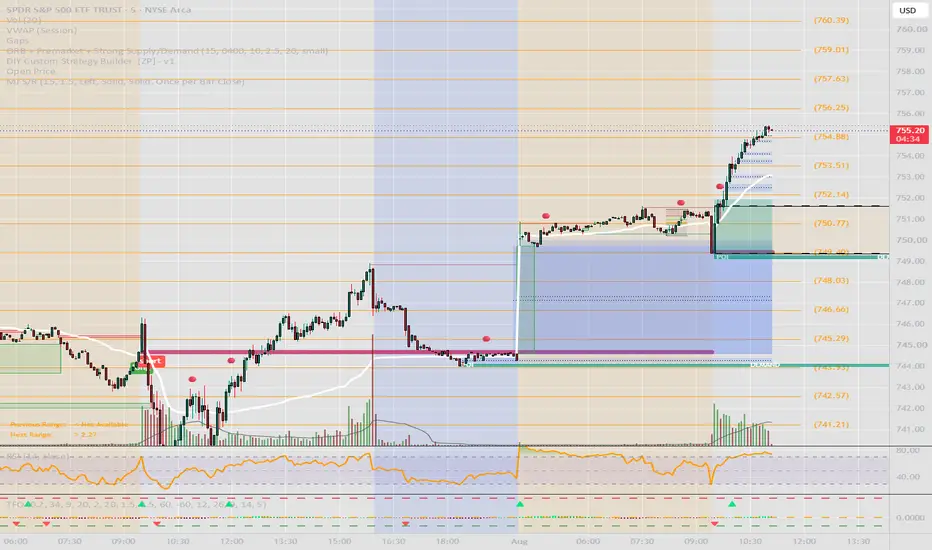
MJ Automatic Support & Resistance
MJ Automatic Support & Resistance is a chart-based indicator designed to automatically identify and display key support and resistance levels using confirmed pivot highs and pivot lows.
The indicator recalculates based on the active chart timeframe, so the levels automatically update when switching between intraday, daily, or higher timeframes.
Key Features
. Automatically detects support and resistance levels
. Works across all chart timeframes
. Uses confirmed pivot highs and lows
. Separate color controls for support and resistance
. Separate line-thickness controls for support and resistance
. Adjustable pivot sensitivity
. Optional merging of nearby levels
. Adjustable maximum number of displayed levels
. Minimum-touch filter for stronger levels
. Solid, dashed, and dotted line options
. Adjustable line transparency
. Optional price labels
. Optional removal of broken levels
. Adjustable ATR-based breakout confirmation buffer
. Ability to show or hide support and resistance independently
How It Works
Resistance levels are created from confirmed pivot highs, while support levels are created from confirmed pivot lows.
When multiple pivots form near the same price, the indicator can merge them into one level using an ATR-based distance filter. The level price is then averaged as additional touches are detected.
Users can also require a minimum number of touches before a level becomes visible, helping reduce weaker or less-tested levels.
Important Note
Pivot-based levels require future candles to confirm. Because of this, a new support or resistance level will appear only after the selected pivot-strength period has passed.
A higher Pivot Strength generally produces fewer but stronger levels. A lower Pivot Strength produces more levels and reacts faster to short-term price structure.
Suggested Settings
For a balanced chart:
Pivot Strength: 5
Maximum Levels: 30–50
Merge Nearby Levels: Enabled
Merge Distance: 0.20 ATR
Minimum Touches: 1–2
Support Thickness: 2
Resistance Thickness: 2
Lower pivot-strength settings may be more suitable for short-term trading, while higher settings may be better suited for swing trading and higher-timeframe analysis.
Disclaimer
This indicator is intended for technical analysis and educational purposes only. Support and resistance levels are not guaranteed to hold. Traders should combine the indicator with proper risk management, price action, volume, market structure, and other forms of confirmation before making trading decisions
MJ Automatic Support & Resistance is a chart-based indicator designed to automatically identify and display key support and resistance levels using confirmed pivot highs and pivot lows.
The indicator recalculates based on the active chart timeframe, so the levels automatically update when switching between intraday, daily, or higher timeframes.
Key Features
. Automatically detects support and resistance levels
. Works across all chart timeframes
. Uses confirmed pivot highs and lows
. Separate color controls for support and resistance
. Separate line-thickness controls for support and resistance
. Adjustable pivot sensitivity
. Optional merging of nearby levels
. Adjustable maximum number of displayed levels
. Minimum-touch filter for stronger levels
. Solid, dashed, and dotted line options
. Adjustable line transparency
. Optional price labels
. Optional removal of broken levels
. Adjustable ATR-based breakout confirmation buffer
. Ability to show or hide support and resistance independently
How It Works
Resistance levels are created from confirmed pivot highs, while support levels are created from confirmed pivot lows.
When multiple pivots form near the same price, the indicator can merge them into one level using an ATR-based distance filter. The level price is then averaged as additional touches are detected.
Users can also require a minimum number of touches before a level becomes visible, helping reduce weaker or less-tested levels.
Important Note
Pivot-based levels require future candles to confirm. Because of this, a new support or resistance level will appear only after the selected pivot-strength period has passed.
A higher Pivot Strength generally produces fewer but stronger levels. A lower Pivot Strength produces more levels and reacts faster to short-term price structure.
Suggested Settings
For a balanced chart:
Pivot Strength: 5
Maximum Levels: 30–50
Merge Nearby Levels: Enabled
Merge Distance: 0.20 ATR
Minimum Touches: 1–2
Support Thickness: 2
Resistance Thickness: 2
Lower pivot-strength settings may be more suitable for short-term trading, while higher settings may be better suited for swing trading and higher-timeframe analysis.
Disclaimer
This indicator is intended for technical analysis and educational purposes only. Support and resistance levels are not guaranteed to hold. Traders should combine the indicator with proper risk management, price action, volume, market structure, and other forms of confirmation before making trading decisions
릴리즈 노트
.....오픈 소스 스크립트
트레이딩뷰의 진정한 정신에 따라, 이 스크립트의 작성자는 이를 오픈소스로 공개하여 트레이더들이 기능을 검토하고 검증할 수 있도록 했습니다. 작성자에게 찬사를 보냅니다! 이 코드는 무료로 사용할 수 있지만, 코드를 재게시하는 경우 하우스 룰이 적용된다는 점을 기억하세요.

면책사항
해당 정보와 게시물은 금융, 투자, 트레이딩 또는 기타 유형의 조언이나 권장 사항으로 간주되지 않으며, 트레이딩뷰에서 제공하거나 보증하는 것이 아닙니다. 자세한 내용은 이용 약관을 참조하세요.
오픈 소스 스크립트
트레이딩뷰의 진정한 정신에 따라, 이 스크립트의 작성자는 이를 오픈소스로 공개하여 트레이더들이 기능을 검토하고 검증할 수 있도록 했습니다. 작성자에게 찬사를 보냅니다! 이 코드는 무료로 사용할 수 있지만, 코드를 재게시하는 경우 하우스 룰이 적용된다는 점을 기억하세요.
면책사항
해당 정보와 게시물은 금융, 투자, 트레이딩 또는 기타 유형의 조언이나 권장 사항으로 간주되지 않으며, 트레이딩뷰에서 제공하거나 보증하는 것이 아닙니다. 자세한 내용은 이용 약관을 참조하세요.