No wick candle KOCA
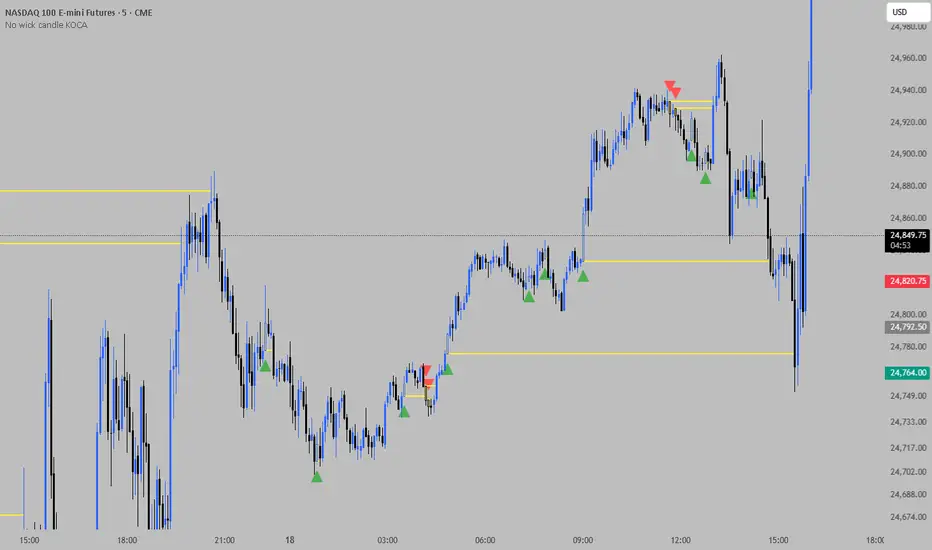
Description
This indicator is designed to identify institutional momentum and high-probability retest zones based on candles with missing wicks (specifically Open Marubozu candles).
When a candle opens and immediately moves in one direction without any retracement (no wick on the opening side), it signals strong institutional aggression. These levels often act as magnets for future price action, providing excellent entry opportunities upon retest.
Key Features
Yellow Candles: Highlights candles that opened without a wick (Pure Open). This means the Open price is exactly equal to the Low (for bullish) or exactly equal to the High (for bearish).
Dynamic Retest Lines: Once a "No Wick" candle is identified, a horizontal line is drawn at that specific price level.
Automatic Mitigation: The line remains active in the chart until the price returns and touches it (Mitigation). Once the level is retested, the line automatically stops extending, showing you which levels are still "open" and which are "filled."
Directional Signals: * Green Triangle Up: Appears on a Bullish "No Wick" candle.
Red Triangle Down: Appears on a Bearish "No Wick" candle.
How to Use
Identification: Look for the yellow candles. They represent strong price movement where big players entered the market.
The Level: The horizontal line marks a significant Support or Resistance level.
The Entry (Retest): Many profitable setups occur when the price returns to this line. Look for a "touch" of the line to enter a trade in the original direction of the momentum.
Stop Loss: A logical placement for a Stop Loss is often on the opposite side of the signaling yellow candle.

면책사항
해당 정보와 게시물은 금융, 투자, 트레이딩 또는 기타 유형의 조언이나 권장 사항으로 간주되지 않으며, 트레이딩뷰에서 제공하거나 보증하는 것이 아닙니다. 자세한 내용은 이용 약관을 참조하세요.
면책사항
해당 정보와 게시물은 금융, 투자, 트레이딩 또는 기타 유형의 조언이나 권장 사항으로 간주되지 않으며, 트레이딩뷰에서 제공하거나 보증하는 것이 아닙니다. 자세한 내용은 이용 약관을 참조하세요.