OPEN-SOURCE SCRIPT
FeraTrading Rolling Price Magnet
FeraTrading Rolling Price Magnet
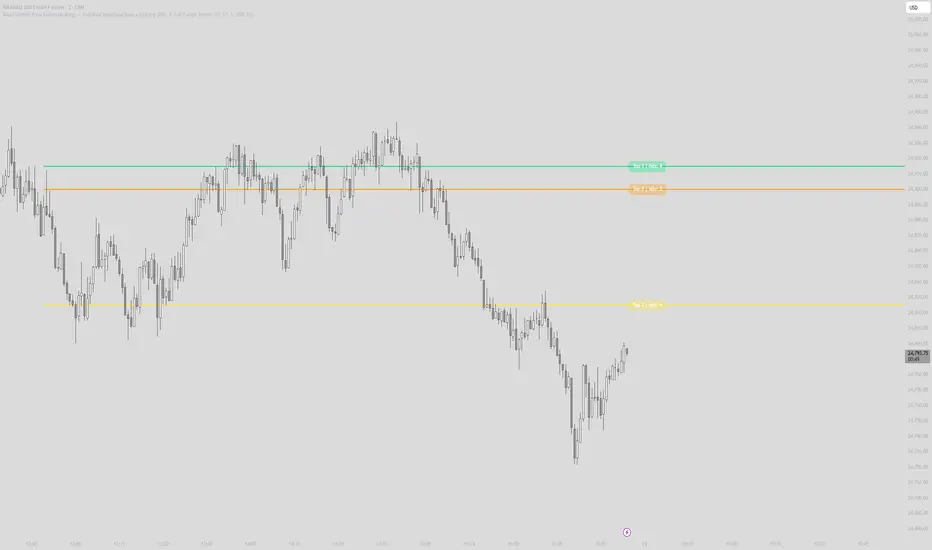
This indicator highlights the price zones where the market has spent the most time over a recent window of bars. Instead of using moving averages or fixed levels, it scans past price action and identifies the levels that price has interacted with most frequently, helping reveal natural areas of interest, support, or resistance.
Overview
The script looks back a user-defined number of bars and breaks the price range into small zones (bins). It then counts how often price traveled through each zone and ranks them by frequency. The most-visited levels are plotted directly on the chart as horizontal lines.
This creates a dynamic view of where the market has been spending time, rather than relying on static indicators or lagging averages.
How It Works
The indicator looks back over the last X bars.
Each candle contributes price “hits” based on the selected mode:
Full Range: Counts all price levels between the candle’s low and high.
Positive Close: Only counts upward movement for candles that closed higher than the previous close.
Negative Close: Only counts downward movement for candles that closed lower than the previous close.
Price is grouped into small zones using a configurable bin size.
The script counts how often price passes through each zone.
The top most-visited levels are plotted as horizontal lines.
Visual Behavior
Green line: Most-visited price level.
Yellow line: Second most-visited level.
Orange line: Third most-visited level.
Optional labels display how many times each level was hit.
Lines update continuously as the rolling lookback window moves forward.
Inputs
Lookback Bars: Number of past bars used to calculate levels.
Top Levels: How many price levels to display.
Hit Mode:
Full Range
Positive Close
Negative Close
Bin Size: Controls the width of each price zone (in ticks or points).
Spacing Filter: Option to only count bars that are a minimum number of bars apart.
Line Width / Label Toggle: Visual customization options.
Use Case Summary
This indicator is useful for:
Finding natural support and resistance zones.
Identifying price “acceptance” areas.
Spotting magnets where price tends to return.
It works well across intraday and swing timeframes, especially on liquid instruments where price interacts frequently with key levels.
This indicator highlights the price zones where the market has spent the most time over a recent window of bars. Instead of using moving averages or fixed levels, it scans past price action and identifies the levels that price has interacted with most frequently, helping reveal natural areas of interest, support, or resistance.
Overview
The script looks back a user-defined number of bars and breaks the price range into small zones (bins). It then counts how often price traveled through each zone and ranks them by frequency. The most-visited levels are plotted directly on the chart as horizontal lines.
This creates a dynamic view of where the market has been spending time, rather than relying on static indicators or lagging averages.
How It Works
The indicator looks back over the last X bars.
Each candle contributes price “hits” based on the selected mode:
Full Range: Counts all price levels between the candle’s low and high.
Positive Close: Only counts upward movement for candles that closed higher than the previous close.
Negative Close: Only counts downward movement for candles that closed lower than the previous close.
Price is grouped into small zones using a configurable bin size.
The script counts how often price passes through each zone.
The top most-visited levels are plotted as horizontal lines.
Visual Behavior
Green line: Most-visited price level.
Yellow line: Second most-visited level.
Orange line: Third most-visited level.
Optional labels display how many times each level was hit.
Lines update continuously as the rolling lookback window moves forward.
Inputs
Lookback Bars: Number of past bars used to calculate levels.
Top Levels: How many price levels to display.
Hit Mode:
Full Range
Positive Close
Negative Close
Bin Size: Controls the width of each price zone (in ticks or points).
Spacing Filter: Option to only count bars that are a minimum number of bars apart.
Line Width / Label Toggle: Visual customization options.
Use Case Summary
This indicator is useful for:
Finding natural support and resistance zones.
Identifying price “acceptance” areas.
Spotting magnets where price tends to return.
It works well across intraday and swing timeframes, especially on liquid instruments where price interacts frequently with key levels.
오픈 소스 스크립트
트레이딩뷰의 진정한 정신에 따라, 이 스크립트의 작성자는 이를 오픈소스로 공개하여 트레이더들이 기능을 검토하고 검증할 수 있도록 했습니다. 작성자에게 찬사를 보냅니다! 이 코드는 무료로 사용할 수 있지만, 코드를 재게시하는 경우 하우스 룰이 적용된다는 점을 기억하세요.

Enjoy :)
면책사항
해당 정보와 게시물은 금융, 투자, 트레이딩 또는 기타 유형의 조언이나 권장 사항으로 간주되지 않으며, 트레이딩뷰에서 제공하거나 보증하는 것이 아닙니다. 자세한 내용은 이용 약관을 참조하세요.
오픈 소스 스크립트
트레이딩뷰의 진정한 정신에 따라, 이 스크립트의 작성자는 이를 오픈소스로 공개하여 트레이더들이 기능을 검토하고 검증할 수 있도록 했습니다. 작성자에게 찬사를 보냅니다! 이 코드는 무료로 사용할 수 있지만, 코드를 재게시하는 경우 하우스 룰이 적용된다는 점을 기억하세요.
Enjoy :)
면책사항
해당 정보와 게시물은 금융, 투자, 트레이딩 또는 기타 유형의 조언이나 권장 사항으로 간주되지 않으며, 트레이딩뷰에서 제공하거나 보증하는 것이 아닙니다. 자세한 내용은 이용 약관을 참조하세요.