OPEN-SOURCE SCRIPT
Customized Double Bollinger Bands [wjdtks255]
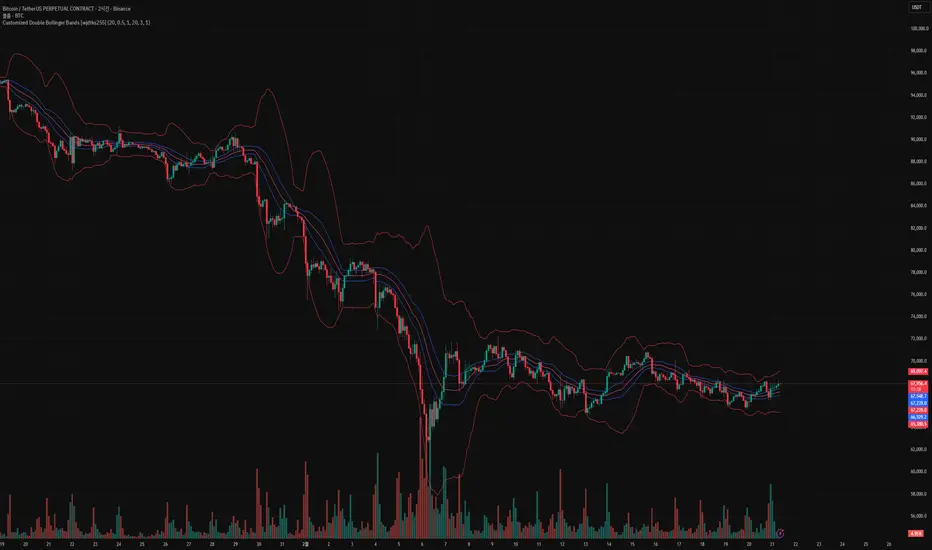
■ Technical Overview
The Customized Double Bollinger Bands is a multi-layered volatility analysis framework. Unlike standard single-band indicators, this script synchronizes two independent volatility engines to identify both the "Value Area" (Band 1) and "Extreme Volatility Zones" (Band 2) simultaneously on a single interface.
■ Implementation & Logic
Dual-Deviation Synchronization: The script calculates two distinct standard deviation layers ($StdDev_{0.5}$ and $StdDev_{3.0}$) to provide a high-fidelity view of price distribution.
Dynamic Range Compression: By comparing the gap between the Blue (Inner) and Red (Outer) bands, traders can visually identify "Squeeze" and "Expansion" phases with institutional-grade precision.
■ Key Features
Fully Customizable Layers: Independent control over 'Length', 'StdDev', and 'Color' for both band sets allows for adaptive strategies across different timeframes.
Optimized Visual Clarity: Designed with specific line-width controls to ensure the chart remains readable even during high-volatility spikes.
■ Trading Method
Core Trend: Use the Inner Blue Bands ($0.5$ StdDev) to track the primary trend strength.
Reversal Watch: Use the Outer Red Bands ($3.0$ StdDev) as exhaustion points where price is statistically overextended.
The Customized Double Bollinger Bands is a multi-layered volatility analysis framework. Unlike standard single-band indicators, this script synchronizes two independent volatility engines to identify both the "Value Area" (Band 1) and "Extreme Volatility Zones" (Band 2) simultaneously on a single interface.
■ Implementation & Logic
Dual-Deviation Synchronization: The script calculates two distinct standard deviation layers ($StdDev_{0.5}$ and $StdDev_{3.0}$) to provide a high-fidelity view of price distribution.
Dynamic Range Compression: By comparing the gap between the Blue (Inner) and Red (Outer) bands, traders can visually identify "Squeeze" and "Expansion" phases with institutional-grade precision.
■ Key Features
Fully Customizable Layers: Independent control over 'Length', 'StdDev', and 'Color' for both band sets allows for adaptive strategies across different timeframes.
Optimized Visual Clarity: Designed with specific line-width controls to ensure the chart remains readable even during high-volatility spikes.
■ Trading Method
Core Trend: Use the Inner Blue Bands ($0.5$ StdDev) to track the primary trend strength.
Reversal Watch: Use the Outer Red Bands ($3.0$ StdDev) as exhaustion points where price is statistically overextended.
오픈 소스 스크립트
트레이딩뷰의 진정한 정신에 따라, 이 스크립트의 작성자는 이를 오픈소스로 공개하여 트레이더들이 기능을 검토하고 검증할 수 있도록 했습니다. 작성자에게 찬사를 보냅니다! 이 코드는 무료로 사용할 수 있지만, 코드를 재게시하는 경우 하우스 룰이 적용된다는 점을 기억하세요.

면책사항
해당 정보와 게시물은 금융, 투자, 트레이딩 또는 기타 유형의 조언이나 권장 사항으로 간주되지 않으며, 트레이딩뷰에서 제공하거나 보증하는 것이 아닙니다. 자세한 내용은 이용 약관을 참조하세요.
오픈 소스 스크립트
트레이딩뷰의 진정한 정신에 따라, 이 스크립트의 작성자는 이를 오픈소스로 공개하여 트레이더들이 기능을 검토하고 검증할 수 있도록 했습니다. 작성자에게 찬사를 보냅니다! 이 코드는 무료로 사용할 수 있지만, 코드를 재게시하는 경우 하우스 룰이 적용된다는 점을 기억하세요.
면책사항
해당 정보와 게시물은 금융, 투자, 트레이딩 또는 기타 유형의 조언이나 권장 사항으로 간주되지 않으며, 트레이딩뷰에서 제공하거나 보증하는 것이 아닙니다. 자세한 내용은 이용 약관을 참조하세요.