OPEN-SOURCE SCRIPT
Quant Grade Stochastic
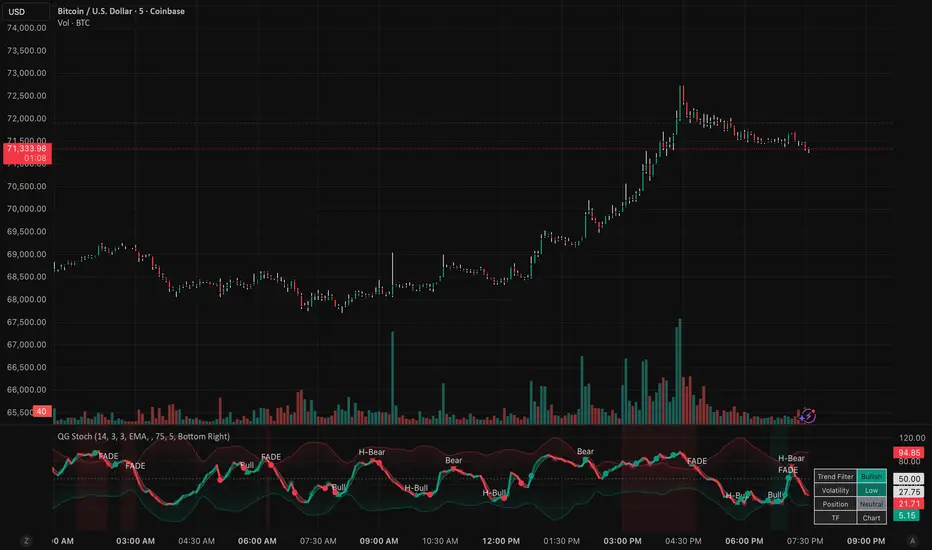
The Quant Grade Stochastic is an institutional-level momentum workstation designed to solve the primary flaw of traditional oscillators: static overbought and oversold levels. In modern markets, static 80/20 or 70/30 levels often lead to "premature fading" in strong trends or missed entries during low-volatility regimes.
This script replaces fixed levels with Adaptive Volatility Zones—dynamic bands that expand and contract based on the market's standard deviation. This allows traders to identify true momentum extremes relative to current market conditions, not arbitrary numbers.
🚀 Key Quant Features
1. Adaptive Volatility Zones (Mean Reversion)
Unlike the standard Stochastic, the OB/OS levels are calculated using a volatility-adjusted engine. When volatility spikes, the zones expand to prevent "false" overbought signals. When volatility drops, the zones contract to catch micro-extremes.
2. Momentum Heatmap (Acceleration Analysis)
The %K line is color-coded based on its internal slope and acceleration.
Bright Colors: Indicate strong momentum and acceleration.
Dull Colors: Indicate momentum deceleration—a quant-grade "early warning" that a trend is tiring even before a crossover occurs.
3. Institutional Dashboard
A real-time status table that provides a high-level overview of market mechanics:
Trend Filter: Instant identification of the primary trend using a 200 EMA.
Volatility State: Quantifies if current market volatility is High or Low relative to its 50-period average.
Position State: Classifies the oscillator’s current location (Overbought, Oversold, or Neutral).
4. Dual Divergence Engine
Detects two distinct types of momentum anomalies:
Regular Divergence: Traditional reversal signals where price and momentum disconnect.
Hidden Divergence: Quant-grade trend continuation signals, identifying high-probability pullbacks in a trending market.
5. Smart Fade Signals
Markers specifically designed for the "Return-to-Range" strategy. When the %K line exits an extreme volatility zone and crosses back inside, a FADE signal is generated. These signals are visually filtered by the 200 EMA trend engine to prioritize "With-Trend" opportunities.
💡 How to Trade
The Fade Strategy: Wait for the %K line to go above the Adaptive Upper Zone. When it crosses back under that zone, look for a short entry. The "FADE" marker highlights this exact moment.
The Trend Follower: Use Hidden Divergence markers during pullbacks in a Bullish Trend (confirmed by the Dashboard) to find low-risk continuation entries.
Volatility Squeeze: When the Adaptive Zones are extremely tight (indicated by "Low" Volatility on the Dashboard), look for a Momentum Heatmap breakout to signify the start of a new expansion.
🛠️ Settings
Engine: Choose from 5 different smoothing types (SMA, EMA, WMA, HMA, ALMA).
Adaptive Zones: Customize the Standard Deviation multiplier to tighten or loosen your extremes.
Multi-Timeframe: Sync your momentum analysis with higher timeframes without leaving your current chart.
Quant Filter: Toggle the 200 EMA trend filter to clean up counter-trend noise.
This script replaces fixed levels with Adaptive Volatility Zones—dynamic bands that expand and contract based on the market's standard deviation. This allows traders to identify true momentum extremes relative to current market conditions, not arbitrary numbers.
🚀 Key Quant Features
1. Adaptive Volatility Zones (Mean Reversion)
Unlike the standard Stochastic, the OB/OS levels are calculated using a volatility-adjusted engine. When volatility spikes, the zones expand to prevent "false" overbought signals. When volatility drops, the zones contract to catch micro-extremes.
2. Momentum Heatmap (Acceleration Analysis)
The %K line is color-coded based on its internal slope and acceleration.
Bright Colors: Indicate strong momentum and acceleration.
Dull Colors: Indicate momentum deceleration—a quant-grade "early warning" that a trend is tiring even before a crossover occurs.
3. Institutional Dashboard
A real-time status table that provides a high-level overview of market mechanics:
Trend Filter: Instant identification of the primary trend using a 200 EMA.
Volatility State: Quantifies if current market volatility is High or Low relative to its 50-period average.
Position State: Classifies the oscillator’s current location (Overbought, Oversold, or Neutral).
4. Dual Divergence Engine
Detects two distinct types of momentum anomalies:
Regular Divergence: Traditional reversal signals where price and momentum disconnect.
Hidden Divergence: Quant-grade trend continuation signals, identifying high-probability pullbacks in a trending market.
5. Smart Fade Signals
Markers specifically designed for the "Return-to-Range" strategy. When the %K line exits an extreme volatility zone and crosses back inside, a FADE signal is generated. These signals are visually filtered by the 200 EMA trend engine to prioritize "With-Trend" opportunities.
💡 How to Trade
The Fade Strategy: Wait for the %K line to go above the Adaptive Upper Zone. When it crosses back under that zone, look for a short entry. The "FADE" marker highlights this exact moment.
The Trend Follower: Use Hidden Divergence markers during pullbacks in a Bullish Trend (confirmed by the Dashboard) to find low-risk continuation entries.
Volatility Squeeze: When the Adaptive Zones are extremely tight (indicated by "Low" Volatility on the Dashboard), look for a Momentum Heatmap breakout to signify the start of a new expansion.
🛠️ Settings
Engine: Choose from 5 different smoothing types (SMA, EMA, WMA, HMA, ALMA).
Adaptive Zones: Customize the Standard Deviation multiplier to tighten or loosen your extremes.
Multi-Timeframe: Sync your momentum analysis with higher timeframes without leaving your current chart.
Quant Filter: Toggle the 200 EMA trend filter to clean up counter-trend noise.
오픈 소스 스크립트
트레이딩뷰의 진정한 정신에 따라, 이 스크립트의 작성자는 이를 오픈소스로 공개하여 트레이더들이 기능을 검토하고 검증할 수 있도록 했습니다. 작성자에게 찬사를 보냅니다! 이 코드는 무료로 사용할 수 있지만, 코드를 재게시하는 경우 하우스 룰이 적용된다는 점을 기억하세요.

면책사항
해당 정보와 게시물은 금융, 투자, 트레이딩 또는 기타 유형의 조언이나 권장 사항으로 간주되지 않으며, 트레이딩뷰에서 제공하거나 보증하는 것이 아닙니다. 자세한 내용은 이용 약관을 참조하세요.
오픈 소스 스크립트
트레이딩뷰의 진정한 정신에 따라, 이 스크립트의 작성자는 이를 오픈소스로 공개하여 트레이더들이 기능을 검토하고 검증할 수 있도록 했습니다. 작성자에게 찬사를 보냅니다! 이 코드는 무료로 사용할 수 있지만, 코드를 재게시하는 경우 하우스 룰이 적용된다는 점을 기억하세요.
면책사항
해당 정보와 게시물은 금융, 투자, 트레이딩 또는 기타 유형의 조언이나 권장 사항으로 간주되지 않으며, 트레이딩뷰에서 제공하거나 보증하는 것이 아닙니다. 자세한 내용은 이용 약관을 참조하세요.