업데이트됨
RSI Candles [cI8DH]
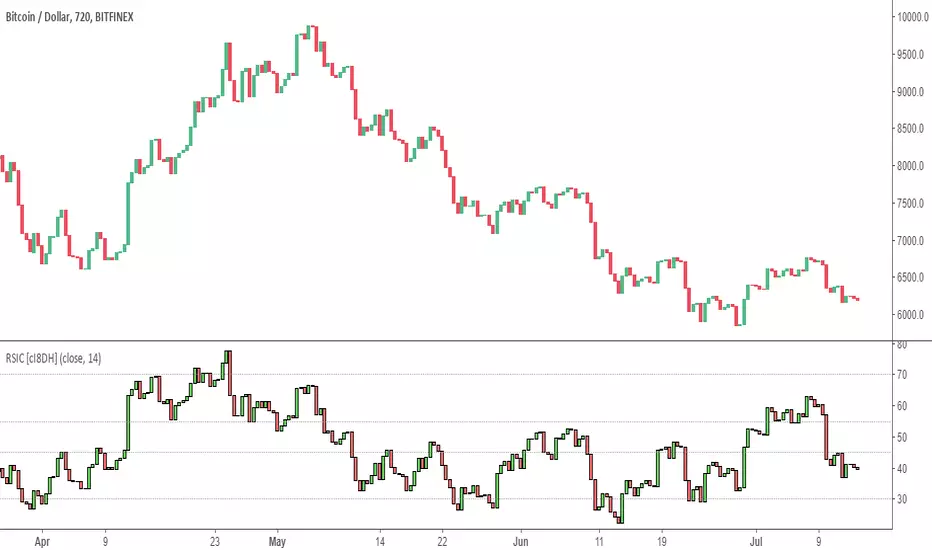
This is candle visualization of regular RSI. That's all.
I have seen two other RSI candles, but their implementation is not correct. The high on RSI usually matches the low on price and vice versa. I have completely turned off the wicks so you can safely use this indicator as a replacement for regular RSI.
I have seen two other RSI candles, but their implementation is not correct. The high on RSI usually matches the low on price and vice versa. I have completely turned off the wicks so you can safely use this indicator as a replacement for regular RSI.
릴리즈 노트
added a band as requested by my friend릴리즈 노트
- Added dynamic inner band that can be used during sideways periods- Implemented the True RSI fix explained here

릴리즈 노트
- added standard deviation inner band calculation method릴리즈 노트
- minor code optimization
면책사항
해당 정보와 게시물은 금융, 투자, 트레이딩 또는 기타 유형의 조언이나 권장 사항으로 간주되지 않으며, 트레이딩뷰에서 제공하거나 보증하는 것이 아닙니다. 자세한 내용은 이용 약관을 참조하세요.
면책사항
해당 정보와 게시물은 금융, 투자, 트레이딩 또는 기타 유형의 조언이나 권장 사항으로 간주되지 않으며, 트레이딩뷰에서 제공하거나 보증하는 것이 아닙니다. 자세한 내용은 이용 약관을 참조하세요.