PSP - NQ ES YM
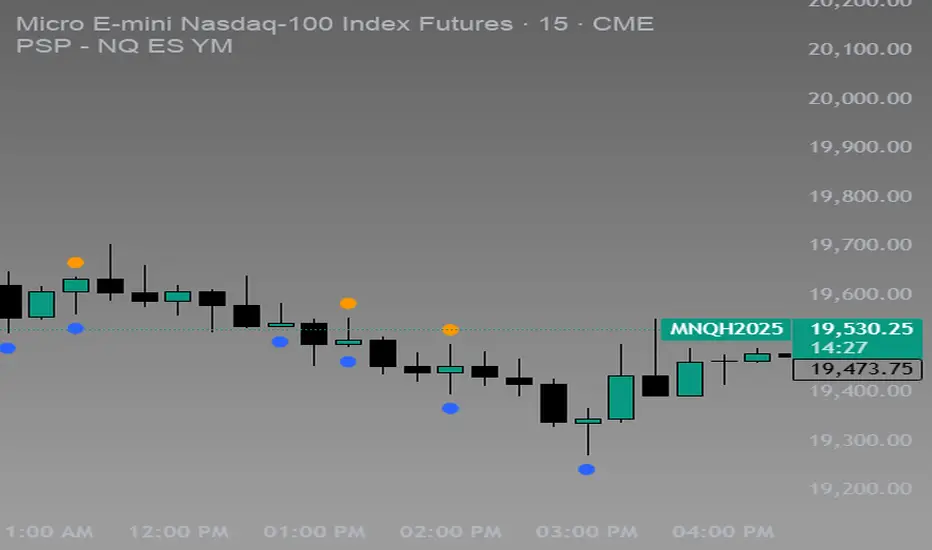
The PSP - NQ ES YM indicator tracks the price movements of the NQ, ES, and YM futures to identify correlation and divergence between them.
🔸 Orange dot (above candle) → When NQ and ES have opposite trends (one up, one down).
🔹 Blue dot (below candle) → When YM differs from either NQ or ES, but NQ and ES are aligned.
🟠🔹 Both dots on the same candle → When NQ and ES differ, and one of them also differs from YM.
🟢 Green dot (above candle at 12 AM NY time) → Marks the daily open at 12 AM New York time.
This helps traders spot market divergence patterns between major indices and potential trading opportunities. 🚀

면책사항
해당 정보와 게시물은 금융, 투자, 트레이딩 또는 기타 유형의 조언이나 권장 사항으로 간주되지 않으며, 트레이딩뷰에서 제공하거나 보증하는 것이 아닙니다. 자세한 내용은 이용 약관을 참조하세요.
면책사항
해당 정보와 게시물은 금융, 투자, 트레이딩 또는 기타 유형의 조언이나 권장 사항으로 간주되지 않으며, 트레이딩뷰에서 제공하거나 보증하는 것이 아닙니다. 자세한 내용은 이용 약관을 참조하세요.