OPEN-SOURCE SCRIPT
RSI Background Color Indicator
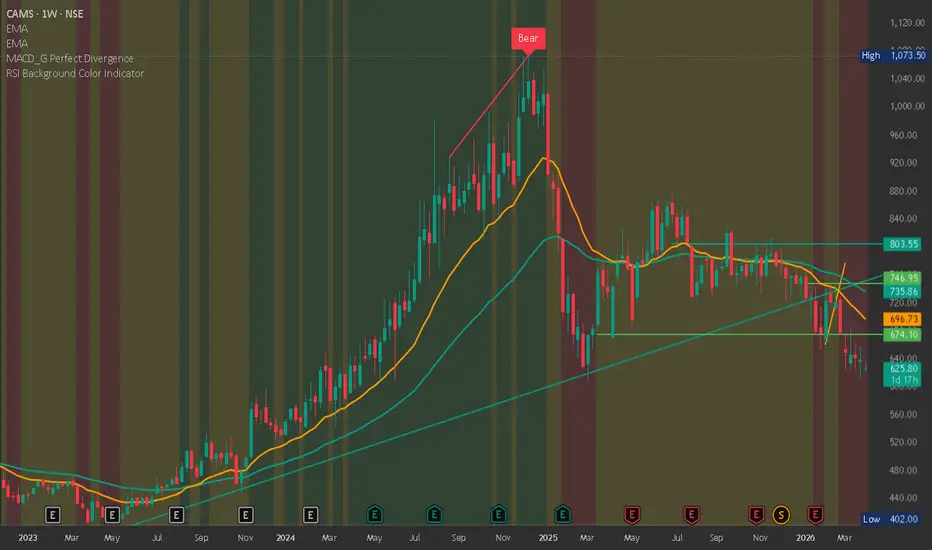
📊 RSI Background Trend Indicator
This indicator is designed to visually simplify market conditions using the Relative Strength Index (RSI) by dynamically changing the chart background color based on momentum zones. It helps traders quickly identify whether the market is bullish, bearish, or neutral without relying on multiple indicators.
⚙️ How It Works
The indicator calculates RSI and categorizes the market into three zones:
🟢 Bullish Zone (RSI > 60)
Indicates strong upward momentum and potential buying strength.
🔴 Bearish Zone (RSI < 40)
Indicates downward pressure and potential selling strength.
🟡 Neutral Zone (RSI between 40–60)
Represents consolidation or sideways movement.
The background color of the chart automatically changes based on these conditions, making it easy to interpret market sentiment at a glance.
🎯 Key Features
✔ Clean and minimal visual representation
✔ No clutter — focus only on momentum zones
✔ Works on all timeframes and instruments
✔ Customizable RSI length and levels
✔ Helps in quick decision-making
📈 How to Use
Use Green background to look for buy setups (pullbacks, breakouts)
Use Red background to look for sell setups (rejections, breakdowns)
Avoid trades or use range strategies during Yellow zone
⚡ Pro Tips
Combine with EMA trend (50/200) for higher accuracy
Use with price action (Support/Resistance, HH/HL, LH/LL)
Confirm entries with volume or breakout patterns
Works best when aligned across multiple timeframes
⚠️ Disclaimer
This indicator is for educational and informational purposes only. It does not provide financial advice. Always use proper risk management before trading.
If you want, I can also:
🔥 Optimize this description for more views & followers
🔥 Add SEO tags & title suggestions
🔥 Create a premium-looking indicator branding
This indicator is designed to visually simplify market conditions using the Relative Strength Index (RSI) by dynamically changing the chart background color based on momentum zones. It helps traders quickly identify whether the market is bullish, bearish, or neutral without relying on multiple indicators.
⚙️ How It Works
The indicator calculates RSI and categorizes the market into three zones:
🟢 Bullish Zone (RSI > 60)
Indicates strong upward momentum and potential buying strength.
🔴 Bearish Zone (RSI < 40)
Indicates downward pressure and potential selling strength.
🟡 Neutral Zone (RSI between 40–60)
Represents consolidation or sideways movement.
The background color of the chart automatically changes based on these conditions, making it easy to interpret market sentiment at a glance.
🎯 Key Features
✔ Clean and minimal visual representation
✔ No clutter — focus only on momentum zones
✔ Works on all timeframes and instruments
✔ Customizable RSI length and levels
✔ Helps in quick decision-making
📈 How to Use
Use Green background to look for buy setups (pullbacks, breakouts)
Use Red background to look for sell setups (rejections, breakdowns)
Avoid trades or use range strategies during Yellow zone
⚡ Pro Tips
Combine with EMA trend (50/200) for higher accuracy
Use with price action (Support/Resistance, HH/HL, LH/LL)
Confirm entries with volume or breakout patterns
Works best when aligned across multiple timeframes
⚠️ Disclaimer
This indicator is for educational and informational purposes only. It does not provide financial advice. Always use proper risk management before trading.
If you want, I can also:
🔥 Optimize this description for more views & followers
🔥 Add SEO tags & title suggestions
🔥 Create a premium-looking indicator branding
오픈 소스 스크립트
트레이딩뷰의 진정한 정신에 따라, 이 스크립트의 작성자는 이를 오픈소스로 공개하여 트레이더들이 기능을 검토하고 검증할 수 있도록 했습니다. 작성자에게 찬사를 보냅니다! 이 코드는 무료로 사용할 수 있지만, 코드를 재게시하는 경우 하우스 룰이 적용된다는 점을 기억하세요.

면책사항
해당 정보와 게시물은 금융, 투자, 트레이딩 또는 기타 유형의 조언이나 권장 사항으로 간주되지 않으며, 트레이딩뷰에서 제공하거나 보증하는 것이 아닙니다. 자세한 내용은 이용 약관을 참조하세요.
오픈 소스 스크립트
트레이딩뷰의 진정한 정신에 따라, 이 스크립트의 작성자는 이를 오픈소스로 공개하여 트레이더들이 기능을 검토하고 검증할 수 있도록 했습니다. 작성자에게 찬사를 보냅니다! 이 코드는 무료로 사용할 수 있지만, 코드를 재게시하는 경우 하우스 룰이 적용된다는 점을 기억하세요.
면책사항
해당 정보와 게시물은 금융, 투자, 트레이딩 또는 기타 유형의 조언이나 권장 사항으로 간주되지 않으며, 트레이딩뷰에서 제공하거나 보증하는 것이 아닙니다. 자세한 내용은 이용 약관을 참조하세요.