OPEN-SOURCE SCRIPT
Dynamic ATR v1.0
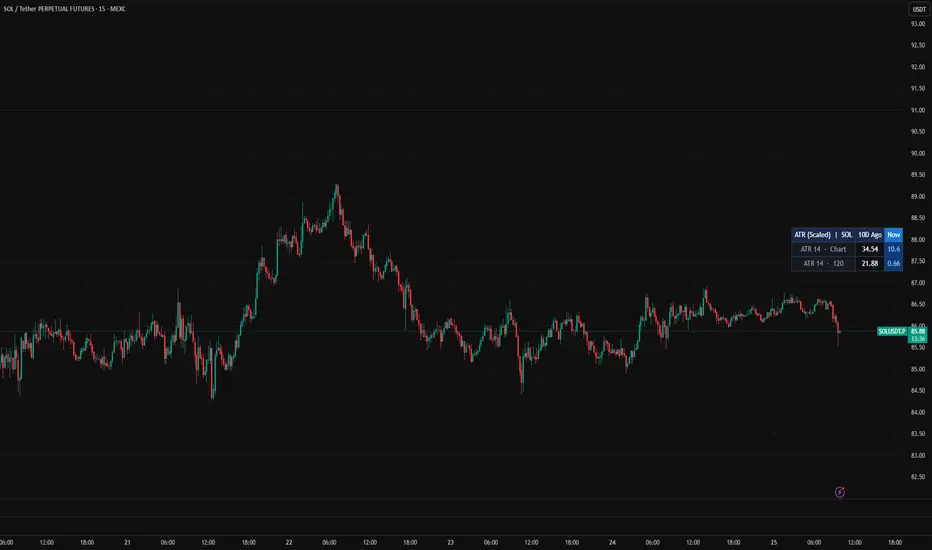
Dynamic ATR displays the Average True Range of any token across two timeframes — the chart timeframe and a configurable higher timeframe (default 2H) — with an…Dynamic ATR displays the Average True Range of any token across two timeframes — the chart timeframe and a configurable higher timeframe (default 2H) — with an optional 0–50 normalization that scales each ATR value relative to its own 360-bar history, making volatility directly comparable across different tokens regardless of their price magnitude. Alongside the current readings, it also shows a snapshot of both ATR values from 10 calendar days ago, giving you a quick sense of whether volatility has expanded or contracted recently. The result is a compact table you can position anywhere on the chart, useful for scanning multiple tokens side by side and spotting which ones are in high or low volatility regimes relative to their own history.
Created by Milad Saberi — April 2026
Created by Milad Saberi — April 2026
오픈 소스 스크립트
트레이딩뷰의 진정한 정신에 따라, 이 스크립트의 작성자는 이를 오픈소스로 공개하여 트레이더들이 기능을 검토하고 검증할 수 있도록 했습니다. 작성자에게 찬사를 보냅니다! 이 코드는 무료로 사용할 수 있지만, 코드를 재게시하는 경우 하우스 룰이 적용된다는 점을 기억하세요.

면책사항
해당 정보와 게시물은 금융, 투자, 트레이딩 또는 기타 유형의 조언이나 권장 사항으로 간주되지 않으며, 트레이딩뷰에서 제공하거나 보증하는 것이 아닙니다. 자세한 내용은 이용 약관을 참조하세요.
오픈 소스 스크립트
트레이딩뷰의 진정한 정신에 따라, 이 스크립트의 작성자는 이를 오픈소스로 공개하여 트레이더들이 기능을 검토하고 검증할 수 있도록 했습니다. 작성자에게 찬사를 보냅니다! 이 코드는 무료로 사용할 수 있지만, 코드를 재게시하는 경우 하우스 룰이 적용된다는 점을 기억하세요.
면책사항
해당 정보와 게시물은 금융, 투자, 트레이딩 또는 기타 유형의 조언이나 권장 사항으로 간주되지 않으며, 트레이딩뷰에서 제공하거나 보증하는 것이 아닙니다. 자세한 내용은 이용 약관을 참조하세요.