OPEN-SOURCE SCRIPT
Follow-Through Day (FTD) Detector
📈 Follow-Through Day (FTD) Detector
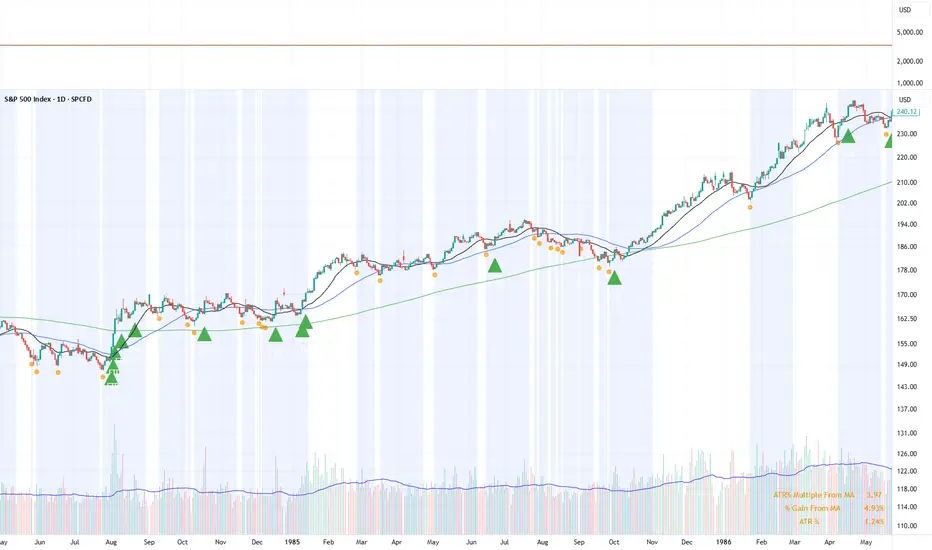
Marks Follow-Through Days on any chart using the classic William O'Neil / IBD methodology — a signal that a correction may be turning into a new uptrend attempt.
🔍 How it works
The script tracks rally attempts bar-by-bar. A rally begins when price is at or near a recent low (default 15-bar lookback) and closes up — that's Day 1. From there, the counter advances each bar. An FTD fires when, on day 4 or later of the attempt, the instrument closes up by at least the gain threshold (default 1.5%) on volume greater than the prior bar. If the rally's starting low is undercut before an FTD prints, the attempt resets.
🎨 On the chart
Green triangle below the bar on the FTD
Orange dot marking Day 1 of each rally attempt
Light blue background across the duration of an active attempt
Built-in alert condition
⚙️ Inputs
Minimum gain % (default 1.5 — IBD historically used 1.7%)
Earliest and latest day of the rally count (default 4 to 25)
Toggle for the higher-volume requirement
Lookback window for the recent-low check
Toggles for each visual element
✅ Pros
Faithful to the original rules, but fully parameterized
Works on any symbol and timeframe
Rally shading makes the setup visible in real time, not only after the signal fires
Clean state machine — no lookahead, no repainting
⚠️ Cons and caveats
FTDs are a probabilistic signal. Historically a meaningful share fail, and the script does not attempt to filter good vs bad ones
On cash indices like SPX, TradingView's volume is aggregated and can be noisy — disable the volume requirement or apply the indicator to SPY / ES futures
The rally-low reset uses the low of the first two bars of the attempt; a deeper correction low further back in the sell-off isn't tracked
Purely mechanical — doesn't incorporate market breadth, leadership, or distribution days, which IBD treats as essential companions
Defaults are a starting point, not a tuned edge. Backtest before trading off it
Feedback and suggestions welcome.
Marks Follow-Through Days on any chart using the classic William O'Neil / IBD methodology — a signal that a correction may be turning into a new uptrend attempt.
🔍 How it works
The script tracks rally attempts bar-by-bar. A rally begins when price is at or near a recent low (default 15-bar lookback) and closes up — that's Day 1. From there, the counter advances each bar. An FTD fires when, on day 4 or later of the attempt, the instrument closes up by at least the gain threshold (default 1.5%) on volume greater than the prior bar. If the rally's starting low is undercut before an FTD prints, the attempt resets.
🎨 On the chart
Green triangle below the bar on the FTD
Orange dot marking Day 1 of each rally attempt
Light blue background across the duration of an active attempt
Built-in alert condition
⚙️ Inputs
Minimum gain % (default 1.5 — IBD historically used 1.7%)
Earliest and latest day of the rally count (default 4 to 25)
Toggle for the higher-volume requirement
Lookback window for the recent-low check
Toggles for each visual element
✅ Pros
Faithful to the original rules, but fully parameterized
Works on any symbol and timeframe
Rally shading makes the setup visible in real time, not only after the signal fires
Clean state machine — no lookahead, no repainting
⚠️ Cons and caveats
FTDs are a probabilistic signal. Historically a meaningful share fail, and the script does not attempt to filter good vs bad ones
On cash indices like SPX, TradingView's volume is aggregated and can be noisy — disable the volume requirement or apply the indicator to SPY / ES futures
The rally-low reset uses the low of the first two bars of the attempt; a deeper correction low further back in the sell-off isn't tracked
Purely mechanical — doesn't incorporate market breadth, leadership, or distribution days, which IBD treats as essential companions
Defaults are a starting point, not a tuned edge. Backtest before trading off it
Feedback and suggestions welcome.
오픈 소스 스크립트
트레이딩뷰의 진정한 정신에 따라, 이 스크립트의 작성자는 이를 오픈소스로 공개하여 트레이더들이 기능을 검토하고 검증할 수 있도록 했습니다. 작성자에게 찬사를 보냅니다! 이 코드는 무료로 사용할 수 있지만, 코드를 재게시하는 경우 하우스 룰이 적용된다는 점을 기억하세요.

면책사항
해당 정보와 게시물은 금융, 투자, 트레이딩 또는 기타 유형의 조언이나 권장 사항으로 간주되지 않으며, 트레이딩뷰에서 제공하거나 보증하는 것이 아닙니다. 자세한 내용은 이용 약관을 참조하세요.
오픈 소스 스크립트
트레이딩뷰의 진정한 정신에 따라, 이 스크립트의 작성자는 이를 오픈소스로 공개하여 트레이더들이 기능을 검토하고 검증할 수 있도록 했습니다. 작성자에게 찬사를 보냅니다! 이 코드는 무료로 사용할 수 있지만, 코드를 재게시하는 경우 하우스 룰이 적용된다는 점을 기억하세요.
면책사항
해당 정보와 게시물은 금융, 투자, 트레이딩 또는 기타 유형의 조언이나 권장 사항으로 간주되지 않으며, 트레이딩뷰에서 제공하거나 보증하는 것이 아닙니다. 자세한 내용은 이용 약관을 참조하세요.