OPEN-SOURCE SCRIPT
Bollinger Band Flow Heatmap | julzALGO
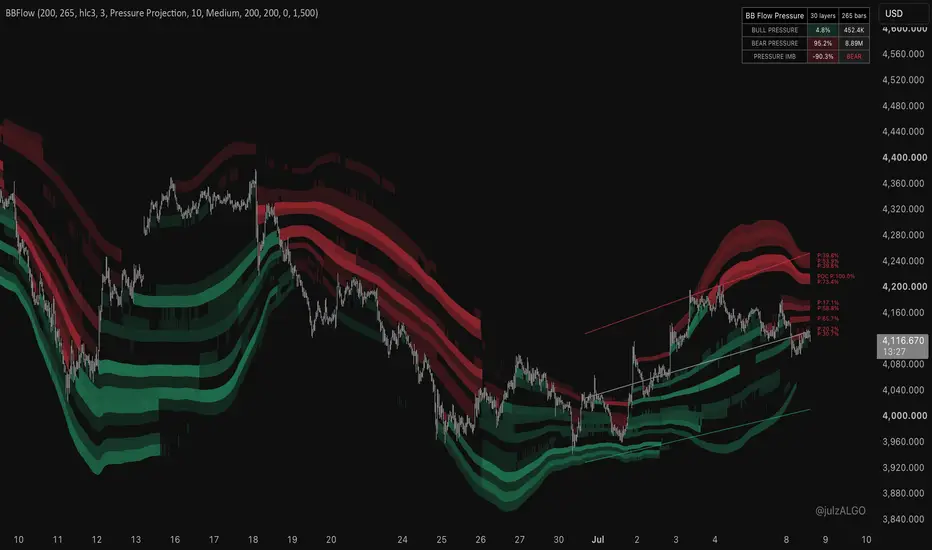
📘 The Bollinger Band Flow Heatmap is a market pressure visualization indicator that maps SmartFlow activity inside a dynamic Bollinger Band channel. Instead of treating the Bollinger Bands as simple upper and lower boundaries, the indicator divides the entire channel into 30 adaptive pressure layers and measures how buying and selling pressure accumulates within each layer.
Powered by the julzALGO SmartFlow Engine, the indicator combines raw volume with OHLC candle structure to map where market participation is concentrated. The result is a dynamic pressure map that helps traders identify potential support, resistance, pressure imbalance, and high-interest price zones.
🟠 FEATURES
◉ 30-Layer Pressure Engine

The Bollinger Band channel is automatically divided into 30 adaptive pressure layers. Every scanned bar contributes SmartFlow pressure into the appropriate layer, creating a detailed profile of where buying and selling activity has accumulated over time.
◉ julzALGO SmartFlow Engine

The SmartFlow Engine calculates market pressure using multiple components, including:
* Raw volume
* Candle body direction
* Close position within the candle range
* Upper and lower wick structure
* Volume Z-Score weighting
* Flow acceleration
* SmartFlow pressure boosting
◉ Pressure Labels

Each visible pressure layer can display a P:% value representing its relative pressure strength.
The strongest pressure layer is automatically identified as the POC (Point of Control).
◉ Dynamic Bollinger Channel Guide Lines

The indicator can display the Upper Band, Middle Basis, and Lower Band as adaptive channel guide lines.
These guides provide the framework for the 30-layer pressure engine, helping visualize where SmartFlow pressure accumulates inside the Bollinger Band channel.
The channel guides can also be used to:
• Visualize the current volatility envelope.
• Identify potential dynamic support and resistance.
• Provide context for pressure accumulation relative to the upper, middle, and lower Bollinger Bands.
• Improve interpretation of pressure layers during trending and ranging market conditions.
The guide lines automatically update with the selected Band Length, Band Source, and Band Deviation, ensuring the pressure map always reflects the current Bollinger Band channel.
◉ Pressure Dashboard

The dashboard summarizes pressure distribution across the Bollinger channel:
• BULL PRESSURE — Total pressure accumulated below the current price.
• BEAR PRESSURE — Total pressure accumulated above the current price.
• PRESSURE IMB — Percentage imbalance between bull and bear pressure.
🟠 HOW IT WORKS
The indicator first builds a Bollinger Band channel using the selected source, band length, and deviation multiplier.
The space between the upper and lower Bollinger Bands is divided into 30 adaptive pressure layers.
For every scanned candle, the julzALGO SmartFlow Engine calculates SmartFlow pressure using raw volume together with OHLC candle structure.
Depending on the selected allocation mode, the calculated SmartFlow pressure is either projected into the nearest pressure layer or distributed across every layer touched by the candle.
As additional bars are processed, pressure accumulates throughout the channel, allowing the strongest participation zones to become increasingly visible.
🟠 HOW TO READ THE INDICATOR

• Strong pressure below price may represent an area of accumulated buying pressure that can act as potential support or demand.
• Strong pressure above price may represent an area of accumulated selling pressure that can act as potential resistance or supply.
• The POC (Point of Control) identifies the pressure layer with the highest accumulated SmartFlow pressure within the current scan.
• Pressure Imbalance quickly indicates whether bull or bear pressure is currently dominant across the channel.
• The Bollinger Channel Guide Lines provide the adaptive framework for the pressure layers and help visualize pressure relative to the upper band, basis, and lower band.
This indicator is designed to complement price action, market structure, trend analysis, and risk management rather than generate automatic buy or sell signals.
⚙️ DEFAULT SETTINGS
Recommended starting values:
* Band Length: 200
* Pressure Scan Bars: 265
* Band Deviation: 3.0
* Pressure Allocation Source: Pressure Projection
* Strongest Pressure Layers: 10
* Pressure Style: Medium
Reduce the scan bars for faster-moving markets, or increase them for more historical context.
Increase the band deviation to widen the adaptive channel.
Increase the number of visible pressure layers to reveal additional areas of accumulated market participation.
⚠️ Disclaimer
This indicator is provided for educational and informational purposes only. It is designed to visualize SmartFlow pressure within a Bollinger Band channel and does not predict future price movements or guarantee trading outcomes.
SmartFlow pressure is derived from raw volume and OHLC candle structure. It is not exchange-provided bid/ask footprint data, Level II market depth, or institutional order flow.
Pressure layers, POC levels, and pressure imbalances should be interpreted as areas of interest, not definitive buy or sell signals. Always confirm trading decisions using your own price action, market structure, trend analysis, and risk management.
Trading and investing involve substantial financial risk. Past performance does not guarantee future results. You are solely responsible for your own trading decisions and risk management.
Powered by the julzALGO SmartFlow Engine, the indicator combines raw volume with OHLC candle structure to map where market participation is concentrated. The result is a dynamic pressure map that helps traders identify potential support, resistance, pressure imbalance, and high-interest price zones.
🟠 FEATURES
◉ 30-Layer Pressure Engine
The Bollinger Band channel is automatically divided into 30 adaptive pressure layers. Every scanned bar contributes SmartFlow pressure into the appropriate layer, creating a detailed profile of where buying and selling activity has accumulated over time.
◉ julzALGO SmartFlow Engine
The SmartFlow Engine calculates market pressure using multiple components, including:
* Raw volume
* Candle body direction
* Close position within the candle range
* Upper and lower wick structure
* Volume Z-Score weighting
* Flow acceleration
* SmartFlow pressure boosting
◉ Pressure Labels
Each visible pressure layer can display a P:% value representing its relative pressure strength.
The strongest pressure layer is automatically identified as the POC (Point of Control).
◉ Dynamic Bollinger Channel Guide Lines
The indicator can display the Upper Band, Middle Basis, and Lower Band as adaptive channel guide lines.
These guides provide the framework for the 30-layer pressure engine, helping visualize where SmartFlow pressure accumulates inside the Bollinger Band channel.
The channel guides can also be used to:
• Visualize the current volatility envelope.
• Identify potential dynamic support and resistance.
• Provide context for pressure accumulation relative to the upper, middle, and lower Bollinger Bands.
• Improve interpretation of pressure layers during trending and ranging market conditions.
The guide lines automatically update with the selected Band Length, Band Source, and Band Deviation, ensuring the pressure map always reflects the current Bollinger Band channel.
◉ Pressure Dashboard
The dashboard summarizes pressure distribution across the Bollinger channel:
• BULL PRESSURE — Total pressure accumulated below the current price.
• BEAR PRESSURE — Total pressure accumulated above the current price.
• PRESSURE IMB — Percentage imbalance between bull and bear pressure.
🟠 HOW IT WORKS
The indicator first builds a Bollinger Band channel using the selected source, band length, and deviation multiplier.
The space between the upper and lower Bollinger Bands is divided into 30 adaptive pressure layers.
For every scanned candle, the julzALGO SmartFlow Engine calculates SmartFlow pressure using raw volume together with OHLC candle structure.
Depending on the selected allocation mode, the calculated SmartFlow pressure is either projected into the nearest pressure layer or distributed across every layer touched by the candle.
As additional bars are processed, pressure accumulates throughout the channel, allowing the strongest participation zones to become increasingly visible.
🟠 HOW TO READ THE INDICATOR
• Strong pressure below price may represent an area of accumulated buying pressure that can act as potential support or demand.
• Strong pressure above price may represent an area of accumulated selling pressure that can act as potential resistance or supply.
• The POC (Point of Control) identifies the pressure layer with the highest accumulated SmartFlow pressure within the current scan.
• Pressure Imbalance quickly indicates whether bull or bear pressure is currently dominant across the channel.
• The Bollinger Channel Guide Lines provide the adaptive framework for the pressure layers and help visualize pressure relative to the upper band, basis, and lower band.
This indicator is designed to complement price action, market structure, trend analysis, and risk management rather than generate automatic buy or sell signals.
⚙️ DEFAULT SETTINGS
Recommended starting values:
* Band Length: 200
* Pressure Scan Bars: 265
* Band Deviation: 3.0
* Pressure Allocation Source: Pressure Projection
* Strongest Pressure Layers: 10
* Pressure Style: Medium
Reduce the scan bars for faster-moving markets, or increase them for more historical context.
Increase the band deviation to widen the adaptive channel.
Increase the number of visible pressure layers to reveal additional areas of accumulated market participation.
⚠️ Disclaimer
This indicator is provided for educational and informational purposes only. It is designed to visualize SmartFlow pressure within a Bollinger Band channel and does not predict future price movements or guarantee trading outcomes.
SmartFlow pressure is derived from raw volume and OHLC candle structure. It is not exchange-provided bid/ask footprint data, Level II market depth, or institutional order flow.
Pressure layers, POC levels, and pressure imbalances should be interpreted as areas of interest, not definitive buy or sell signals. Always confirm trading decisions using your own price action, market structure, trend analysis, and risk management.
Trading and investing involve substantial financial risk. Past performance does not guarantee future results. You are solely responsible for your own trading decisions and risk management.
오픈 소스 스크립트
트레이딩뷰의 진정한 정신에 따라, 이 스크립트의 작성자는 이를 오픈소스로 공개하여 트레이더들이 기능을 검토하고 검증할 수 있도록 했습니다. 작성자에게 찬사를 보냅니다! 이 코드는 무료로 사용할 수 있지만, 코드를 재게시하는 경우 하우스 룰이 적용된다는 점을 기억하세요.

Official julzALGO Community:
discord.gg/FJkAYEAH
discord.gg/FJkAYEAH
면책사항
해당 정보와 게시물은 금융, 투자, 트레이딩 또는 기타 유형의 조언이나 권장 사항으로 간주되지 않으며, 트레이딩뷰에서 제공하거나 보증하는 것이 아닙니다. 자세한 내용은 이용 약관을 참조하세요.
오픈 소스 스크립트
트레이딩뷰의 진정한 정신에 따라, 이 스크립트의 작성자는 이를 오픈소스로 공개하여 트레이더들이 기능을 검토하고 검증할 수 있도록 했습니다. 작성자에게 찬사를 보냅니다! 이 코드는 무료로 사용할 수 있지만, 코드를 재게시하는 경우 하우스 룰이 적용된다는 점을 기억하세요.
Official julzALGO Community:
discord.gg/FJkAYEAH
discord.gg/FJkAYEAH
면책사항
해당 정보와 게시물은 금융, 투자, 트레이딩 또는 기타 유형의 조언이나 권장 사항으로 간주되지 않으며, 트레이딩뷰에서 제공하거나 보증하는 것이 아닙니다. 자세한 내용은 이용 약관을 참조하세요.