OPEN-SOURCE SCRIPT
Volatility Bands Pro-Read [Indicatr]
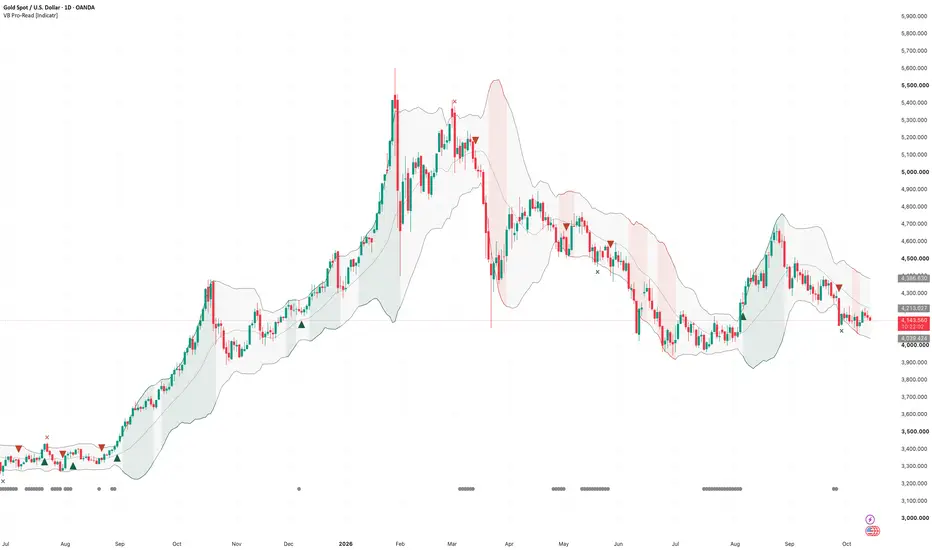
Volatility Bands Pro-Read draws Bollinger Bands, Keltner Channels or Donchian Channels and reads the band behaviour for you: band walk (trend), mean-reversion candidates (no trend) and squeeze - for both directions.
WHAT IT DOES
A common misreading is "price touches the upper band = sell". In a strong trend price can walk along the band for a long time. This script separates band walks from mean-reversion situations using band position and ADX.
HOW IT WORKS
HOW TO USE
THE CHART
XAUUSD (gold) daily with Bollinger Bands (20, 2). Green sections are band walks up, red sections band walks down, grey sections are neutral. Dots at the bottom mark squeeze phases, triangles the squeeze release, crosses mean-reversion candidates.
WHAT IS ORIGINAL
Standard band indicators only draw lines. This script classifies band behaviour (walk vs. reversion) using band position and ADX, and adds squeeze detection for any selected band type.
CREDITS
Bollinger Bands (John Bollinger), Keltner Channel (Chester Keltner, ATR version by Linda Raschke), Donchian Channel (Richard Donchian), squeeze concept (John Carter), ADX (J. Welles Wilder).
LIMITATIONS
Disclaimer
For educational and analytical purposes only. Not financial advice. Marks and signals are not buy or sell recommendations. Past behaviour does not guarantee future results.
WHAT IT DOES
A common misreading is "price touches the upper band = sell". In a strong trend price can walk along the band for a long time. This script separates band walks from mean-reversion situations using band position and ADX.
HOW IT WORKS
- Band type: Bollinger, Keltner or Donchian. The script calculates where the close sits inside the band (0 = lower, 1 = upper).
- Band walk: if ADX shows a trend and several recent closes sit in the outer zone (default 3 of the last 5 above 0.8 or below 0.2), bands and fill are coloured green (walk up) or red (walk down).
- Mean-reversion candidates: when ADX shows no trend and price closes back inside the band after closing outside it, a small cross is marked (long below, short above).
- Squeeze: when Bollinger Bands are inside the Keltner Channel, dots are shown at the bottom. When the squeeze ends, the release is marked above or below the basis.
HOW TO USE
- Band walk colouring: treat touches of the outer band as trend strength, not as reversal signals.
- Mean-reversion marks are only relevant in non-trending conditions.
- Squeeze marks show compressed volatility. The release does not predict the size of the move.
- Alerts: band walk up/down started, squeeze fired up/down, mean-reversion candidate.
THE CHART
XAUUSD (gold) daily with Bollinger Bands (20, 2). Green sections are band walks up, red sections band walks down, grey sections are neutral. Dots at the bottom mark squeeze phases, triangles the squeeze release, crosses mean-reversion candidates.
WHAT IS ORIGINAL
Standard band indicators only draw lines. This script classifies band behaviour (walk vs. reversion) using band position and ADX, and adds squeeze detection for any selected band type.
CREDITS
Bollinger Bands (John Bollinger), Keltner Channel (Chester Keltner, ATR version by Linda Raschke), Donchian Channel (Richard Donchian), squeeze concept (John Carter), ADX (J. Welles Wilder).
LIMITATIONS
- Classification is based on recent closes and ADX and can change on the current bar.
- Squeeze release direction is based on the close relative to the basis and can reverse.
Disclaimer
For educational and analytical purposes only. Not financial advice. Marks and signals are not buy or sell recommendations. Past behaviour does not guarantee future results.
오픈 소스 스크립트
트레이딩뷰의 진정한 정신에 따라, 이 스크립트의 작성자는 이를 오픈소스로 공개하여 트레이더들이 기능을 검토하고 검증할 수 있도록 했습니다. 작성자에게 찬사를 보냅니다! 이 코드는 무료로 사용할 수 있지만, 코드를 재게시하는 경우 하우스 룰이 적용된다는 점을 기억하세요.

Indicatr - the indicators you know, rebuilt with market context: volume, trend and momentum, for long and short. Free open-source tools and Pro tools. Guides and setups: indicator.trading/en/link
면책사항
해당 정보와 게시물은 금융, 투자, 트레이딩 또는 기타 유형의 조언이나 권장 사항으로 간주되지 않으며, 트레이딩뷰에서 제공하거나 보증하는 것이 아닙니다. 자세한 내용은 이용 약관을 참조하세요.
오픈 소스 스크립트
트레이딩뷰의 진정한 정신에 따라, 이 스크립트의 작성자는 이를 오픈소스로 공개하여 트레이더들이 기능을 검토하고 검증할 수 있도록 했습니다. 작성자에게 찬사를 보냅니다! 이 코드는 무료로 사용할 수 있지만, 코드를 재게시하는 경우 하우스 룰이 적용된다는 점을 기억하세요.
Indicatr - the indicators you know, rebuilt with market context: volume, trend and momentum, for long and short. Free open-source tools and Pro tools. Guides and setups: indicator.trading/en/link
면책사항
해당 정보와 게시물은 금융, 투자, 트레이딩 또는 기타 유형의 조언이나 권장 사항으로 간주되지 않으며, 트레이딩뷰에서 제공하거나 보증하는 것이 아닙니다. 자세한 내용은 이용 약관을 참조하세요.