30/50/180 SMAs
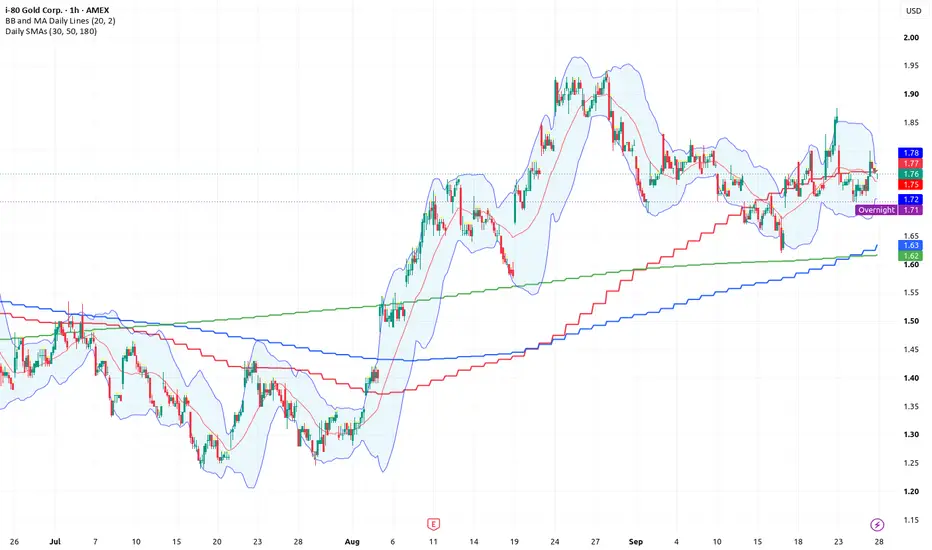
30-Day SMA — Short/Intermediate Term
The 30-day SMA reacts relatively quickly to changes in price.
Rising → short/intermediate trend is strengthening
Falling → trend is weakening
Price above SMA → generally positive short-term structure
Price below SMA → generally negative short-term structure
Best for: identifying recent trend direction and pullbacks.
50-Day SMA — Intermediate Term
The 50-day SMA is one of the most commonly watched moving averages. It is slower and more stable than the 30-day SMA.
Rising 50 SMA → intermediate trend is generally positive
Falling 50 SMA → intermediate trend is generally negative
Price crossing the 50 SMA → potentially important change in intermediate momentum
Best for: confirming whether a short-term move is consistent with the broader intermediate trend.
180-Day SMA — Long Term
The 180-day SMA is much slower and filters out considerably more short-term market noise.
It represents roughly 9 months of trading history.
Rising → long-term trend is generally positive
Falling → long-term trend is generally negative
Price testing the 180 SMA → potentially important long-term trend level
Best for: determining whether the stock's overall long-term trend is still intact.
The 30-day SMA reacts relatively quickly to changes in price.
Rising → short/intermediate trend is strengthening
Falling → trend is weakening
Price above SMA → generally positive short-term structure
Price below SMA → generally negative short-term structure
Best for: identifying recent trend direction and pullbacks.
50-Day SMA — Intermediate Term
The 50-day SMA is one of the most commonly watched moving averages. It is slower and more stable than the 30-day SMA.
Rising 50 SMA → intermediate trend is generally positive
Falling 50 SMA → intermediate trend is generally negative
Price crossing the 50 SMA → potentially important change in intermediate momentum
Best for: confirming whether a short-term move is consistent with the broader intermediate trend.
180-Day SMA — Long Term
The 180-day SMA is much slower and filters out considerably more short-term market noise.
It represents roughly 9 months of trading history.
Rising → long-term trend is generally positive
Falling → long-term trend is generally negative
Price testing the 180 SMA → potentially important long-term trend level
Best for: determining whether the stock's overall long-term trend is still intact.

면책사항
해당 정보와 게시물은 금융, 투자, 트레이딩 또는 기타 유형의 조언이나 권장 사항으로 간주되지 않으며, 트레이딩뷰에서 제공하거나 보증하는 것이 아닙니다. 자세한 내용은 이용 약관을 참조하세요.
면책사항
해당 정보와 게시물은 금융, 투자, 트레이딩 또는 기타 유형의 조언이나 권장 사항으로 간주되지 않으며, 트레이딩뷰에서 제공하거나 보증하는 것이 아닙니다. 자세한 내용은 이용 약관을 참조하세요.