OPEN-SOURCE SCRIPT
Advanced Market Structure & Institutional Dynamic Flow Pro
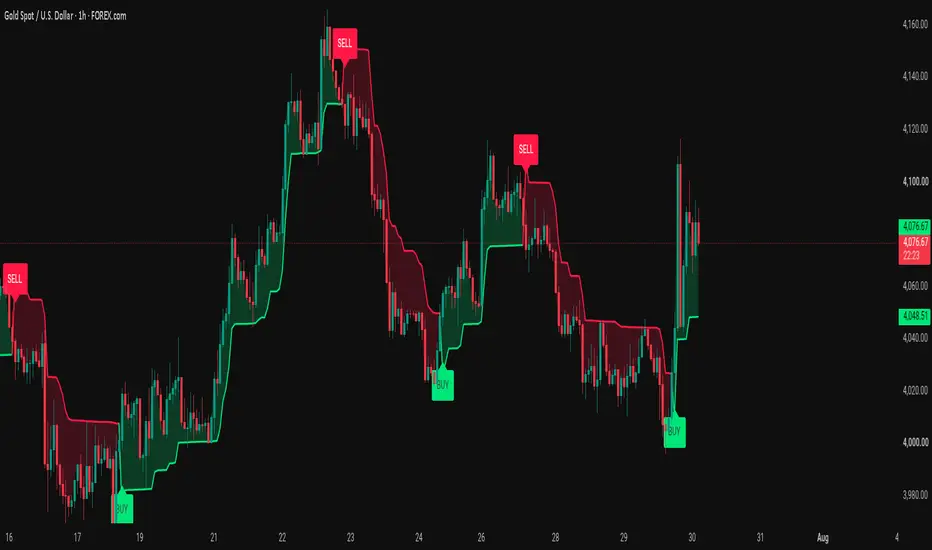
Advanced Market Structure and Institutional Dynamic Flow Pro is a clean and visual indicator built for Pine Script v6. It combines dynamic market structure tracking with curved trend acceleration bands to provide clear directional clarity across various market conditions.
The indicator tracks momentum changes using ATR-based volatility parameters and plots accelerating curved bands that dynamically follow price movement, accompanied by background visual shading and real-time BUY and SELL signals.
Core Features
Curved Radius Trend Acceleration
Maps market trends using a curved band calculation that adjusts as a trend progresses.
Helps visualize trend acceleration and trailing reference levels visually on the chart.
Color coded green during bullish market structure and red during bearish market structure.
Dynamic Trend Fill Shadow
Fills the area between the price and the curved tracking band to highlight trend expansion and contraction.
Shading opacity can be customized in the settings panel.
Structural Entry Badges
Displays BUY labels below swing lows when market structure shifts bullish.
Displays SELL labels above swing highs when market structure shifts bearish.
Settings Breakdown
Supertrend Settings
ATR Length: Adjusts the lookback period for Average True Range calculations (Default: 14).
ATR Multiplier: Controls the distance of the base bands from price (Default: 2.0).
Curve Settings
Radius Curve Acceleration: Controls how tightly or broadly the band curves toward price over time (Default: 0.015).
Visual Settings
Fill Transparency (0-100): Adjusts the transparency of the background trend fill.
How to Use
Trend Direction: Observe the color of the curved tracking line and background shading (Green = Bullish, Red = Bearish).
Signal Confirmation: Watch for BUY and SELL visual markers to identify trend transitions.
Volatility Tracking: Use the curve acceleration to gauge how fast or smooth a trend is progressing.
Things to Avoid
Avoid Isolation Trading: Do not rely solely on single signals; combine them with major market structure levels and overall chart context.
Avoid Default Settings on Extreme Timeframes: Adjust ATR and curve sensitivity parameters when switching between high and low timeframes for optimal visibility.
Disclaimer
Trading financial markets involves risk and can result in the loss of capital. This script is designed for educational and analytical purposes to assist with chart visualization. It is not financial advice or a guarantee of performance. Always conduct independent analysis and maintain risk management practices.
The indicator tracks momentum changes using ATR-based volatility parameters and plots accelerating curved bands that dynamically follow price movement, accompanied by background visual shading and real-time BUY and SELL signals.
Core Features
Curved Radius Trend Acceleration
Maps market trends using a curved band calculation that adjusts as a trend progresses.
Helps visualize trend acceleration and trailing reference levels visually on the chart.
Color coded green during bullish market structure and red during bearish market structure.
Dynamic Trend Fill Shadow
Fills the area between the price and the curved tracking band to highlight trend expansion and contraction.
Shading opacity can be customized in the settings panel.
Structural Entry Badges
Displays BUY labels below swing lows when market structure shifts bullish.
Displays SELL labels above swing highs when market structure shifts bearish.
Settings Breakdown
Supertrend Settings
ATR Length: Adjusts the lookback period for Average True Range calculations (Default: 14).
ATR Multiplier: Controls the distance of the base bands from price (Default: 2.0).
Curve Settings
Radius Curve Acceleration: Controls how tightly or broadly the band curves toward price over time (Default: 0.015).
Visual Settings
Fill Transparency (0-100): Adjusts the transparency of the background trend fill.
How to Use
Trend Direction: Observe the color of the curved tracking line and background shading (Green = Bullish, Red = Bearish).
Signal Confirmation: Watch for BUY and SELL visual markers to identify trend transitions.
Volatility Tracking: Use the curve acceleration to gauge how fast or smooth a trend is progressing.
Things to Avoid
Avoid Isolation Trading: Do not rely solely on single signals; combine them with major market structure levels and overall chart context.
Avoid Default Settings on Extreme Timeframes: Adjust ATR and curve sensitivity parameters when switching between high and low timeframes for optimal visibility.
Disclaimer
Trading financial markets involves risk and can result in the loss of capital. This script is designed for educational and analytical purposes to assist with chart visualization. It is not financial advice or a guarantee of performance. Always conduct independent analysis and maintain risk management practices.
오픈 소스 스크립트
트레이딩뷰의 진정한 정신에 따라, 이 스크립트의 작성자는 이를 오픈소스로 공개하여 트레이더들이 기능을 검토하고 검증할 수 있도록 했습니다. 작성자에게 찬사를 보냅니다! 이 코드는 무료로 사용할 수 있지만, 코드를 재게시하는 경우 하우스 룰이 적용된다는 점을 기억하세요.

Follow The Trend Not The Crowd
Free Telegram Channel
t.me/+M7U84ec7_HYxMjU0
Free Telegram Channel
t.me/+M7U84ec7_HYxMjU0
면책사항
해당 정보와 게시물은 금융, 투자, 트레이딩 또는 기타 유형의 조언이나 권장 사항으로 간주되지 않으며, 트레이딩뷰에서 제공하거나 보증하는 것이 아닙니다. 자세한 내용은 이용 약관을 참조하세요.
오픈 소스 스크립트
트레이딩뷰의 진정한 정신에 따라, 이 스크립트의 작성자는 이를 오픈소스로 공개하여 트레이더들이 기능을 검토하고 검증할 수 있도록 했습니다. 작성자에게 찬사를 보냅니다! 이 코드는 무료로 사용할 수 있지만, 코드를 재게시하는 경우 하우스 룰이 적용된다는 점을 기억하세요.
Follow The Trend Not The Crowd
Free Telegram Channel
t.me/+M7U84ec7_HYxMjU0
Free Telegram Channel
t.me/+M7U84ec7_HYxMjU0
면책사항
해당 정보와 게시물은 금융, 투자, 트레이딩 또는 기타 유형의 조언이나 권장 사항으로 간주되지 않으며, 트레이딩뷰에서 제공하거나 보증하는 것이 아닙니다. 자세한 내용은 이용 약관을 참조하세요.