Developing Value Area [BOSWaves]
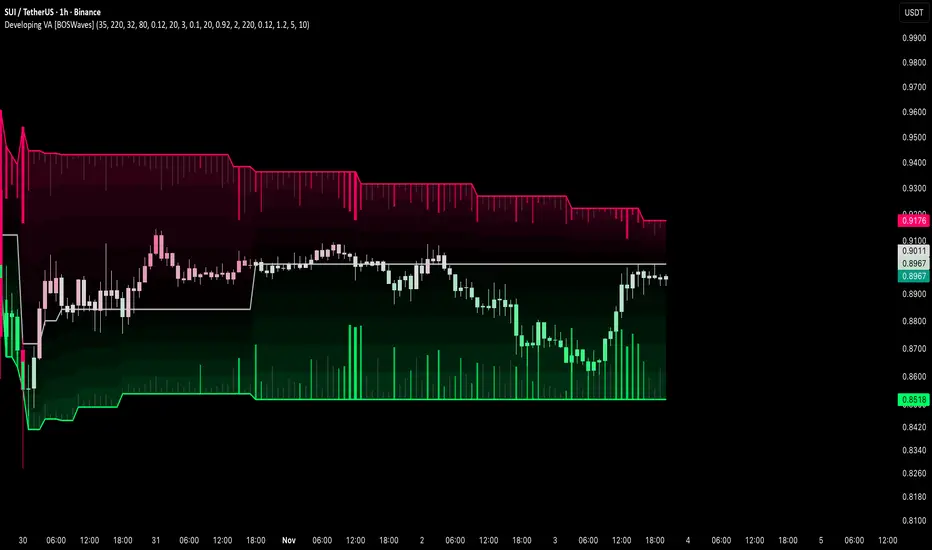
Developing Value Area [BOSWaves] - Rolling Auction Volume Profile with Acceptance-Based Value Shifts, Inward Edge Volume, and Volume-Filtered Value Area Reversals
Overview
Developing Value Area [BOSWaves] is an auction-based value tracking system that builds a volume profile from the bars of the current developing auction, derives the point of control, value area high, and value area low from that profile on every bar, and restarts the auction when price demonstrates sustained acceptance outside of value. Alongside the value structure, it plots inward volume bars from the value area edges to show buying and selling participation on each bar, and marks volume-confirmed reversals when excursions outside value are rejected back inside.

Instead of anchoring value to fixed sessions or calendar periods, each auction begins from a set of initial bars and develops continuously until the market proves it has moved to a new area of value. A value shift is only confirmed when price closes beyond the previous value area edge by an ATR buffer for a required number of consecutive bars, the auction has matured to a minimum length, and the point of control is holding or moving in the direction of the shift. When those conditions are met, a new auction begins from the first bar of acceptance, so value is always measured from the point where the market began trading at new prices.
This creates a value framework that bridges auction theory, volume distribution, and edge behavior within a single indicator. The value area gradient defines where the current auction has accepted price, the point of control marks the price of greatest agreement, the inward volume bars show how buying and selling pressure develop against each edge, and the reversal diamonds highlight where attempts to trade outside value were rejected with meaningful volume.
Price is therefore evaluated not just for its position relative to value, but for whether moves outside value are being accepted into a new auction or rejected back into the existing one.
Conceptual Framework
Developing Value Area is founded on the principle that markets move between periods of balance and periods of discovery, and that value should be measured from the current auction rather than from arbitrary time boundaries. The area where most volume has traded represents prices both buyers and sellers have accepted, while moves beyond that area either attract enough participation to establish new value or fail and return to the existing value area.
Traditional value area tools calculate value from fixed sessions, which mixes separate auctions together when value migrates during the session and splits a single auction in two when it spans several sessions. This framework closes that gap by letting the auction itself define the measurement window, restarting the profile only when acceptance outside value is confirmed, and evaluating rejections from value with explicit duration and volume requirements.
Three core principles guide the design:
This shifts value area analysis from static session profiling into a continuously developing auction model where value migrates with the market and every edge interaction is classified as acceptance, rejection, or neither.
Theoretical Foundation
The indicator combines a rolling auction window, a proportional-overlap volume profile, point of control identification, a value area expansion algorithm, ATR-buffered consecutive-close acceptance testing, excursion tracking with relative volume qualification, and a close-position-weighted inward volume display.
On every bar, the profile spans the highest high to the lowest low of the auction's bars, divided into the configured number of rows. Each bar's volume is distributed across the rows in proportion to how much of its high-low range overlaps each row. The point of control is the row with the most volume. The value area is built outward from the point of control by repeatedly adding whichever adjacent row, above or below, holds more volume until the configured percentage of total auction volume is enclosed. The top of the highest included row becomes the raw value area high and the bottom of the lowest included row becomes the raw value area low.
All acceptance and reversal logic is evaluated against the raw value area from the previous bar, while the displayed VAH and VAL can be expanded slightly away from the point of control for visual clarity without affecting any calculation.
Four internal systems operate in tandem:
This design ensures that value placement, auction transitions, edge rejections, and volume participation are all evaluated from the same developing auction.
How It Works
Developing Value Area evaluates price through a sequence of auction, profile, and edge processes:
Together, these elements form a continuously developing auction model that tracks where value is being established, when it migrates, and how price and volume behave at its edges.
Interpretation
Developing Value Area should be interpreted as a developing auction framework with edge behavior and volume participation layered on top:
Value placement, edge volume, and reversal behavior collectively communicate more auction context than any element in isolation.
Signal Logic & Visual Cues
Developing Value Area presents two primary event types:
Value shifts and reversals are evaluated on confirmed bar closes only. Reversal diamonds are placed at the excursion extreme, which can be several bars before the bar that confirmed the return inside value.
Alert generation covers upper and lower value area reversals and bullish and bearish value shifts for systematic monitoring workflows. The developing VAH, VAL, and POC are also available in the data window.
Strategy Integration
Developing Value Area fits within auction market theory, value area trading, and mean-reversion versus breakout decision frameworks:
Technical Implementation Details
Optimal Application Parameters
Timeframe Guidance:
Suggested Baseline Configuration:
These suggested parameters should be used as a baseline; their effectiveness depends on the instrument's volatility characteristics, volume data quality, and preferred auction sensitivity, so fine-tuning is expected for optimal performance.
Parameter Calibration Notes
Use the following adjustments to refine behavior without altering the core logic:
Adjustments should be incremental and evaluated across multiple session types rather than isolated market conditions.
Performance Characteristics
High Effectiveness:
Reduced Effectiveness:
Integration Guidelines
Disclaimer
Developing Value Area [BOSWaves] is a professional-grade developing auction, volume profile, and value area analysis tool. It uses rolling auction profiling with acceptance-based value shifts and volume-filtered reversal detection but does not predict future price movements. Results depend on market conditions, instrument auction characteristics, volume data quality, parameter selection, and disciplined execution. BOSWaves recommends deploying this indicator within a broader analytical framework that incorporates order flow context, structural analysis, and comprehensive risk management.
Overview
Developing Value Area [BOSWaves] is an auction-based value tracking system that builds a volume profile from the bars of the current developing auction, derives the point of control, value area high, and value area low from that profile on every bar, and restarts the auction when price demonstrates sustained acceptance outside of value. Alongside the value structure, it plots inward volume bars from the value area edges to show buying and selling participation on each bar, and marks volume-confirmed reversals when excursions outside value are rejected back inside.
Instead of anchoring value to fixed sessions or calendar periods, each auction begins from a set of initial bars and develops continuously until the market proves it has moved to a new area of value. A value shift is only confirmed when price closes beyond the previous value area edge by an ATR buffer for a required number of consecutive bars, the auction has matured to a minimum length, and the point of control is holding or moving in the direction of the shift. When those conditions are met, a new auction begins from the first bar of acceptance, so value is always measured from the point where the market began trading at new prices.
This creates a value framework that bridges auction theory, volume distribution, and edge behavior within a single indicator. The value area gradient defines where the current auction has accepted price, the point of control marks the price of greatest agreement, the inward volume bars show how buying and selling pressure develop against each edge, and the reversal diamonds highlight where attempts to trade outside value were rejected with meaningful volume.
Price is therefore evaluated not just for its position relative to value, but for whether moves outside value are being accepted into a new auction or rejected back into the existing one.
Conceptual Framework
Developing Value Area is founded on the principle that markets move between periods of balance and periods of discovery, and that value should be measured from the current auction rather than from arbitrary time boundaries. The area where most volume has traded represents prices both buyers and sellers have accepted, while moves beyond that area either attract enough participation to establish new value or fail and return to the existing value area.
Traditional value area tools calculate value from fixed sessions, which mixes separate auctions together when value migrates during the session and splits a single auction in two when it spans several sessions. This framework closes that gap by letting the auction itself define the measurement window, restarting the profile only when acceptance outside value is confirmed, and evaluating rejections from value with explicit duration and volume requirements.
Three core principles guide the design:
- Value should be measured from the current developing auction, with a new auction beginning only when price shows sustained acceptance outside value rather than at fixed time intervals.
- Acceptance and rejection at the value area edges should be separated with measurable conditions, requiring consecutive closes beyond an ATR buffer for acceptance and a qualifying excursion followed by a return inside value for rejection.
- Volume participation should be shown directly against the value area edges, so the balance of buying and selling pressure on each bar can be read in the context of value.
This shifts value area analysis from static session profiling into a continuously developing auction model where value migrates with the market and every edge interaction is classified as acceptance, rejection, or neither.
Theoretical Foundation
The indicator combines a rolling auction window, a proportional-overlap volume profile, point of control identification, a value area expansion algorithm, ATR-buffered consecutive-close acceptance testing, excursion tracking with relative volume qualification, and a close-position-weighted inward volume display.
On every bar, the profile spans the highest high to the lowest low of the auction's bars, divided into the configured number of rows. Each bar's volume is distributed across the rows in proportion to how much of its high-low range overlaps each row. The point of control is the row with the most volume. The value area is built outward from the point of control by repeatedly adding whichever adjacent row, above or below, holds more volume until the configured percentage of total auction volume is enclosed. The top of the highest included row becomes the raw value area high and the bottom of the lowest included row becomes the raw value area low.
All acceptance and reversal logic is evaluated against the raw value area from the previous bar, while the displayed VAH and VAL can be expanded slightly away from the point of control for visual clarity without affecting any calculation.
Four internal systems operate in tandem:
- Developing Auction Engine: Initializes the first auction from the configured number of seed bars, extends it with every new bar up to the maximum auction length, and recalculates the volume profile, point of control, and raw value area from all bars in the auction on every bar.
- Value Shift System: Counts consecutive confirmed closes beyond the previous raw VAH or VAL plus an ATR buffer, and starts a new auction from the first bar of acceptance once the required closes are reached, the auction has met its minimum length, and the point of control is holding or moving in the shift direction.
- Reversal Detection System: Tracks excursions where the bar's high or low moves beyond the previous raw value area by an ATR buffer, records the excursion extreme and peak relative volume, and confirms a reversal when price closes back inside value after meeting the duration, volume, and spacing requirements. Each side is disarmed after a reversal until price closes back through the point of control.
- Edge Volume System: Plots a vertical bar inward from VAH and another inward from VAL on every confirmed bar, scaling each by relative volume and by where the bar closed within its range, so selling pressure extends down from VAH and buying pressure extends up from VAL.
This design ensures that value placement, auction transitions, edge rejections, and volume participation are all evaluated from the same developing auction.
How It Works
Developing Value Area evaluates price through a sequence of auction, profile, and edge processes:
- Auction Initialization: Once enough bars are available, the first auction begins with the configured number of initial auction bars.
- Auction Development: Each new bar is added to the auction. Once the auction reaches the maximum auction length, the oldest bars drop out as new bars are added.
- Volume Profile Construction: The auction's high-low span is divided into the configured number of rows, and each bar's volume is distributed across those rows by price overlap.
- Point of Control: The row with the highest accumulated volume defines the point of control, plotted at the middle of that row.
- Value Area Calculation: Starting from the point of control, adjacent rows are added one at a time, choosing the side with more volume, until the value area contains the configured percentage of auction volume.
- Display Expansion: The plotted VAH and VAL are pushed slightly away from the point of control by the display expansion fraction. The raw values remain unchanged for all signal logic.
- Acceptance Counting: On each confirmed bar, a close above the previous raw VAH plus the ATR acceptance buffer increases the upside acceptance count, and a close below the previous raw VAL minus the buffer increases the downside count. Any close that fails the condition resets that side's count.
- Value Shift: When the acceptance count reaches the required closes, the auction meets the minimum auction length, and the point of control is at or beyond its previous level in the shift direction, a new auction begins from the first bar of the acceptance sequence. The value lines break for one bar to separate the old and new auctions.
- Excursion Tracking: When a bar's high moves above the previous raw VAH, or its low below the previous raw VAL, by the minimum excursion ATR on an armed side, an excursion begins. Its most extreme price, duration, and peak relative volume are tracked until price closes back inside value.
- Reversal Confirmation: When price closes back inside the previous raw value area, the excursion qualifies as a reversal if it lasted the minimum number of bars, reached the minimum relative volume, and is far enough from the previous reversal. A diamond is placed at the excursion extreme, and that side is disarmed until price closes back through the point of control.
- Inward Volume Bars: On each confirmed bar, a bar extends down from VAH sized by relative volume and weighted toward closes near the bar's low, and a bar extends up from VAL weighted toward closes near the bar's high. Above-average volume bars use the sell and buy colors with opacity and width increasing with relative volume, while below-average volume bars use the low volume color.
- Candle Coloring: Candles inside value shade from neutral at the point of control toward the sell color near VAH and the buy color near VAL. Closes above VAH take the buy color and closes below VAL take the sell color.
Together, these elements form a continuously developing auction model that tracks where value is being established, when it migrates, and how price and volume behave at its edges.
Interpretation
Developing Value Area should be interpreted as a developing auction framework with edge behavior and volume participation layered on top:
- Value Area High (Red/Pink): The upper boundary of the developing value area. Price above VAH is trading at prices the current auction has not yet accepted.
- Value Area Low (Green): The lower boundary of the developing value area. Price below VAL is trading below accepted value.
- Point of Control: The line at the price where the most auction volume has traded, representing the strongest point of agreement between buyers and sellers in the current auction.
- Value Area Gradient: The fill between VAH and VAL is most opaque near each edge and fades toward the point of control, using the sell color in the upper half and the buy color in the lower half.
- Value Line Breaks: A one-bar gap in the VAH, VAL, and POC lines marks a value shift, where the previous auction ended and a new auction began from the first bar of acceptance.
- Upper Volume Bars: Bars extending down from VAH represent selling participation. Taller bars indicate higher relative volume and closes nearer the bar's low. Brighter, wider bars indicate volume well above average.
- Lower Volume Bars: Bars extending up from VAL represent buying participation. Taller bars indicate higher relative volume and closes nearer the bar's high.
- Low Volume Bars (Gray): When enabled, below-average volume bars are shown in the low volume color with a minimum height so they remain visible.
- Upper Reversal Diamond (Red/Pink): Marks the extreme of an excursion above value that met the duration and volume requirements and then closed back inside, indicating rejection of higher prices.
- Lower Reversal Diamond (Green): Marks the extreme of an excursion below value that met the duration and volume requirements and then closed back inside, indicating rejection of lower prices.
- Candle Coloring: Inside value, candle color reflects distance from the point of control toward each edge. Outside value, candles take the full buy color above VAH and the full sell color below VAL.
Value placement, edge volume, and reversal behavior collectively communicate more auction context than any element in isolation.
Signal Logic & Visual Cues
Developing Value Area presents two primary event types:
- Value Shifts: A bullish value shift occurs when consecutive closes above VAH confirm acceptance at higher prices with the point of control holding or rising, and a bearish value shift occurs when consecutive closes below VAL confirm acceptance at lower prices with the point of control holding or falling. Each shift starts a new auction and is shown by a break in the value lines.
- Value Area Reversals (◆): Upper reversals mark rejected excursions above value, and lower reversals mark rejected excursions below value, each placed at the most extreme price reached during the excursion.
Value shifts and reversals are evaluated on confirmed bar closes only. Reversal diamonds are placed at the excursion extreme, which can be several bars before the bar that confirmed the return inside value.
Alert generation covers upper and lower value area reversals and bullish and bearish value shifts for systematic monitoring workflows. The developing VAH, VAL, and POC are also available in the data window.
Strategy Integration
Developing Value Area fits within auction market theory, value area trading, and mean-reversion versus breakout decision frameworks:
- Value Area Rotations: While price remains inside value, treat VAH and VAL as the boundaries of balance and the point of control as the central reference, favoring rotations from one edge back toward the POC or the opposite edge.
- Rejection Trading: Use reversal diamonds as evidence that higher or lower prices were tested with meaningful volume and rejected. An upper reversal supports a return toward the POC or VAL, while a lower reversal supports a return toward the POC or VAH.
- Acceptance Trading: Use value shifts as confirmation that the market has accepted new prices. After a shift, the new auction's developing value becomes the reference for continuation in the shift direction.
- Edge Volume Reading: Compare upper and lower volume bars as price approaches each edge. Strong buying bars from VAL as price tests the lower edge, or strong selling bars from VAH as price tests the upper edge, indicate which side is defending value.
- POC Migration: Monitor the direction of the point of control within the auction. A POC moving steadily toward one edge indicates where volume is building and supports the shift direction requirement for a future value shift.
- Multi-Timeframe Value Alignment: Use a higher-timeframe developing value area as the primary location reference, engaging with lower-timeframe reversals and shifts that align with the higher-timeframe value structure.
Technical Implementation Details
- Auction Engine: Seeded initial auction; rolling auction window capped by maximum auction bars; full profile recalculation on every bar
- Volume Profile: Proportional-overlap volume distribution across configurable rows; highest-volume row as point of control; outward value area expansion choosing the higher-volume adjacent row until the target percentage is reached
- Value Display: Display-only expansion of VAH and VAL; ten-layer gradient fill split at the point of control; line breaks on value shifts
- Value Shift Logic: ATR-buffered consecutive confirmed-close acceptance against the previous bar's raw value area; minimum auction length; point of control direction requirement; new auction anchored at the first acceptance bar
- Reversal Logic: ATR-buffered excursion detection from bar highs and lows; excursion extreme and peak relative volume tracking; duration, volume, and spacing filters; per-side arming reset by a close through the point of control; up to 50 diamonds retained
- Edge Volume: Relative volume against a simple moving average baseline; close-position weighting for upper and lower bars; volume-scaled width, height, and opacity; configurable history
- Visualization: VAH, VAL, and POC lines; gradient fill; inward volume bars; reversal diamonds; position-in-value candle coloring
Optimal Application Parameters
Timeframe Guidance:
- 1 - 5 min: Intraday auction tracking with fewer initial auction bars and a lower maximum auction length so value responds to shifts within the session
- 15 - 60 min: Session-level and multi-session value tracking with balanced auction lengths and moderate acceptance requirements for well-defined value migration
- 4H - Daily: Swing-level value tracking with higher acceptance closes and longer minimum auction length so only sustained moves into new value restart the auction
Suggested Baseline Configuration:
- Initial Auction Bars: 35
- Maximum Auction Bars: 220
- Profile Rows: 32
- Value Area %: 80
- Display Expansion: 0.12
- Minimum Auction Bars: 20
- Acceptance Closes: 3
- Acceptance Buffer ATR: 0.10
- Volume Baseline: 20
- Maximum Bar Height: 0.92
- Base Bar Width: 2
- Volume Bar History: 220
- Show Low Volume Bars: Enabled
- Reversal Diamonds: Enabled
- Minimum Excursion ATR: 0.12
- Minimum Relative Volume: 1.20
- Minimum Excursion Bars: 5
- Minimum Signal Spacing: 10
- Value Area Gradient: Enabled
- Developing POC: Enabled
- Color Candles: Enabled (requires disabling original chart candles in chart settings)
These suggested parameters should be used as a baseline; their effectiveness depends on the instrument's volatility characteristics, volume data quality, and preferred auction sensitivity, so fine-tuning is expected for optimal performance.
Parameter Calibration Notes
Use the following adjustments to refine behavior without altering the core logic:
- Value shifting too often: Increase Acceptance Closes or Acceptance Buffer ATR to require stronger acceptance outside value, or increase Minimum Auction Bars so young auctions cannot shift.
- Value slow to shift: Decrease Acceptance Closes toward 2 or reduce Acceptance Buffer ATR so acceptance outside value is recognized sooner.
- Value area too wide: Decrease Value Area % so a smaller share of volume defines value, producing tighter VAH and VAL levels.
- Value area too narrow: Increase Value Area % toward 90 so more of the auction's volume is included in value.
- Value lagging after long auctions: Decrease Maximum Auction Bars so older bars drop out sooner and value reflects more recent trading.
- POC and value levels too coarse: Increase Profile Rows for finer price resolution, particularly on instruments with wide auction ranges.
- Too many reversal diamonds: Increase Minimum Relative Volume, Minimum Excursion Bars, Minimum Excursion ATR, or Minimum Signal Spacing to require stronger and more distinct rejections.
- Too few reversal diamonds: Decrease Minimum Relative Volume toward 1.0, reduce Minimum Excursion Bars, or lower Minimum Excursion ATR so shorter or lighter excursions can qualify.
- Volume bars too dominant: Reduce Maximum Bar Height or Base Bar Width, or disable Show Low Volume Bars to display only above-average volume.
- Displayed edges too close to price action: Adjust Display Expansion. This changes only how far the plotted VAH and VAL sit from the point of control and does not affect value shifts or reversals.
Adjustments should be incremental and evaluated across multiple session types rather than isolated market conditions.
Performance Characteristics
High Effectiveness:
- Balanced markets that rotate within value for extended periods, allowing the profile to develop clear POC, VAH, and VAL levels
- Markets that alternate between balance and discovery, where acceptance outside value produces clean value shifts into new auctions
- Instruments with reliable volume data, where the profile, relative volume, and edge volume bars accurately reflect participation
- Environments where liquidity is frequently tested beyond value edges and rejected, producing well-defined volume-confirmed reversals
Reduced Effectiveness:
- Instruments without volume data, where the profile, point of control, relative volume, and volume bars cannot be calculated meaningfully
- Strong one-directional trends where value shifts repeatedly, leaving each auction with little time to develop meaningful value levels
- Very choppy markets where price oscillates around the value edges without sustained acceptance or qualifying excursions
- Gap-heavy instruments where price jumps beyond value without trading through the levels between, producing abrupt excursions and shifts
- Very short auctions immediately after a shift, where the profile contains few bars and value levels are still forming
Integration Guidelines
- Confluence: Combine with BOSWaves trend, momentum, or structural tools to decide whether to trade rotations within value or continuation after a value shift
- Auction Maturity: Consider how long the current auction has been developing. Value levels from a new auction carry less weight than those from an auction that has built over many bars.
- Edge Volume Confirmation: Use the inward volume bars to confirm edge tests. Reversals accompanied by strong opposing volume bars at the tested edge carry more evidence of active defense than reversals on light participation.
- Shift Discipline: After a value shift, use the new auction's developing levels as the reference and avoid relying on the previous auction's value area, which no longer reflects where the market is trading.
- Signal Timing Awareness: Reversal diamonds are placed at the excursion extreme but confirmed only when price closes back inside value, so the marker appears after the reversal has developed.
Disclaimer
Developing Value Area [BOSWaves] is a professional-grade developing auction, volume profile, and value area analysis tool. It uses rolling auction profiling with acceptance-based value shifts and volume-filtered reversal detection but does not predict future price movements. Results depend on market conditions, instrument auction characteristics, volume data quality, parameter selection, and disciplined execution. BOSWaves recommends deploying this indicator within a broader analytical framework that incorporates order flow context, structural analysis, and comprehensive risk management.

면책사항
해당 정보와 게시물은 금융, 투자, 트레이딩 또는 기타 유형의 조언이나 권장 사항으로 간주되지 않으며, 트레이딩뷰에서 제공하거나 보증하는 것이 아닙니다. 자세한 내용은 이용 약관을 참조하세요.
면책사항
해당 정보와 게시물은 금융, 투자, 트레이딩 또는 기타 유형의 조언이나 권장 사항으로 간주되지 않으며, 트레이딩뷰에서 제공하거나 보증하는 것이 아닙니다. 자세한 내용은 이용 약관을 참조하세요.