OPEN-SOURCE SCRIPT
Trading Sessions + IB [midst]
What It Does
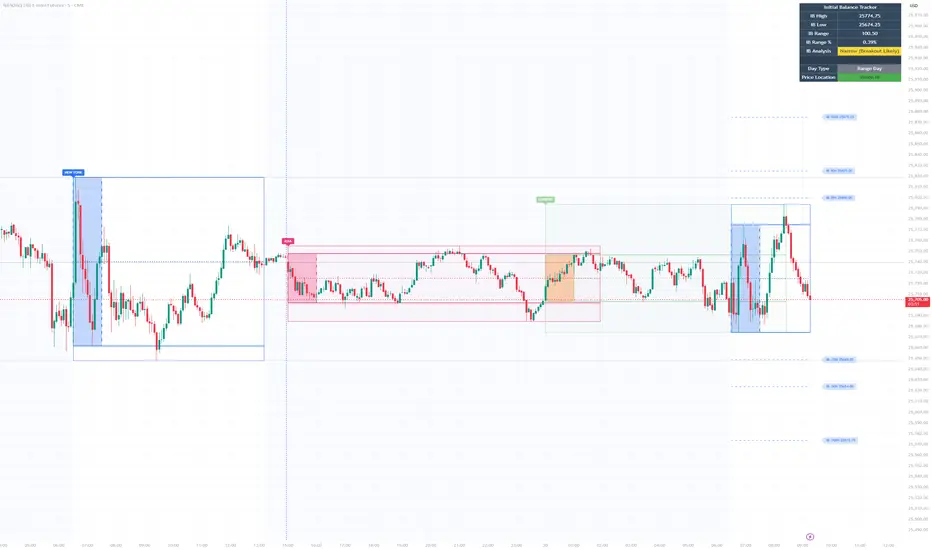
Displays the three major global trading sessions (Asia, London, New York) with Initial Balance (IB) ranges and extension levels. Automatically detects instrument type (ES, NQ, Gold, Silver) and applies correct IB period.
Key Features

Session Boxes: Visual high-to-low range for each session
Initial Balance: First 60 minutes of session range with IB high/mid/low lines
IB Extensions: Automatic calculation of +/-25%, 50%, 100% levels
Live IB Tracker: Real-time statistics table showing IB range, analysis, and market structure
Fully Customizable: Colors, line styles, labels, and display options
Why Use This
Identify key support/resistance levels based on session structure
Track IB breakouts for high-probability trade setups
Use extensions as profit targets or reversal zones
Compare session ranges to gauge volatility
Spot session overlaps for increased liquidity
Default Times (Chicago/Central Time)
Asia: 5:00 PM - 2:00 AM
London: 2:00 AM - 11:00 AM
New York: 7:30 AM - 4:00 PM
How To Use
Add indicator to your chart (works best on 5-15 minute timeframes)
Indicator auto-detects ES, NQ, GC, SI and applies correct 60-minute IB
Watch for price action at IB levels and extensions
Use IB Tracker table for real-time market analysis
Customization
Adjust everything: session times, IB period, colors, line styles, labels, table position. Toggle historical sessions, IB boxes, lines, extensions, and more.
Supported Instruments: ES/MES, NQ/MNQ, GC/MGC (Gold), SI (Silver) - auto-detection included
Displays the three major global trading sessions (Asia, London, New York) with Initial Balance (IB) ranges and extension levels. Automatically detects instrument type (ES, NQ, Gold, Silver) and applies correct IB period.
Key Features
Session Boxes: Visual high-to-low range for each session
Initial Balance: First 60 minutes of session range with IB high/mid/low lines
IB Extensions: Automatic calculation of +/-25%, 50%, 100% levels
Live IB Tracker: Real-time statistics table showing IB range, analysis, and market structure
Fully Customizable: Colors, line styles, labels, and display options
Why Use This
Identify key support/resistance levels based on session structure
Track IB breakouts for high-probability trade setups
Use extensions as profit targets or reversal zones
Compare session ranges to gauge volatility
Spot session overlaps for increased liquidity
Default Times (Chicago/Central Time)
Asia: 5:00 PM - 2:00 AM
London: 2:00 AM - 11:00 AM
New York: 7:30 AM - 4:00 PM
How To Use
Add indicator to your chart (works best on 5-15 minute timeframes)
Indicator auto-detects ES, NQ, GC, SI and applies correct 60-minute IB
Watch for price action at IB levels and extensions
Use IB Tracker table for real-time market analysis
Customization
Adjust everything: session times, IB period, colors, line styles, labels, table position. Toggle historical sessions, IB boxes, lines, extensions, and more.
Supported Instruments: ES/MES, NQ/MNQ, GC/MGC (Gold), SI (Silver) - auto-detection included
오픈 소스 스크립트
트레이딩뷰의 진정한 정신에 따라, 이 스크립트의 작성자는 이를 오픈소스로 공개하여 트레이더들이 기능을 검토하고 검증할 수 있도록 했습니다. 작성자에게 찬사를 보냅니다! 이 코드는 무료로 사용할 수 있지만, 코드를 재게시하는 경우 하우스 룰이 적용된다는 점을 기억하세요.

면책사항
해당 정보와 게시물은 금융, 투자, 트레이딩 또는 기타 유형의 조언이나 권장 사항으로 간주되지 않으며, 트레이딩뷰에서 제공하거나 보증하는 것이 아닙니다. 자세한 내용은 이용 약관을 참조하세요.
오픈 소스 스크립트
트레이딩뷰의 진정한 정신에 따라, 이 스크립트의 작성자는 이를 오픈소스로 공개하여 트레이더들이 기능을 검토하고 검증할 수 있도록 했습니다. 작성자에게 찬사를 보냅니다! 이 코드는 무료로 사용할 수 있지만, 코드를 재게시하는 경우 하우스 룰이 적용된다는 점을 기억하세요.
면책사항
해당 정보와 게시물은 금융, 투자, 트레이딩 또는 기타 유형의 조언이나 권장 사항으로 간주되지 않으며, 트레이딩뷰에서 제공하거나 보증하는 것이 아닙니다. 자세한 내용은 이용 약관을 참조하세요.