OPEN-SOURCE SCRIPT
Dynamic Support & Resistance V3
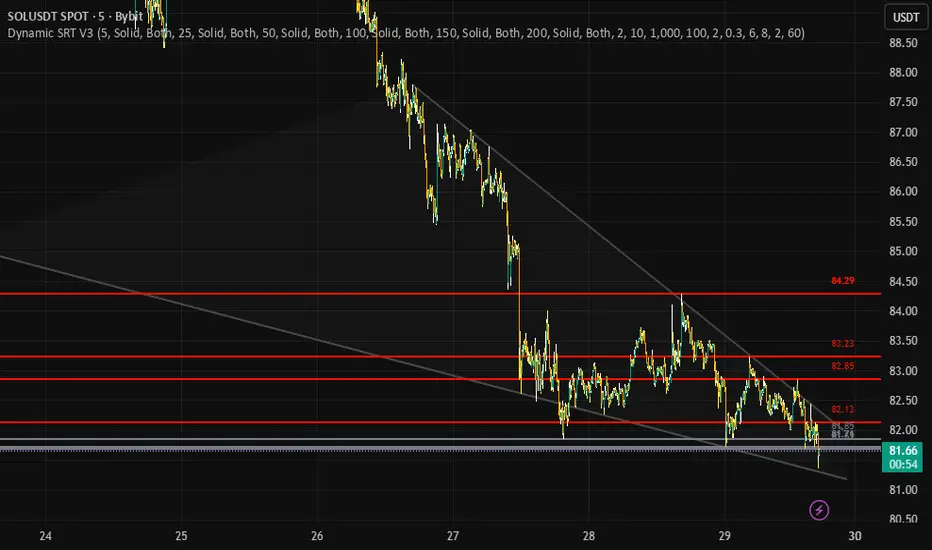
Dynamic SRT V3 by Anonycryptous inspired by Ilja V.
Compared to the previous version, a completely new and accelerated concept.
Dynamic SRT V3 is a professional structural mapping suite that identifies high-density liquidity zones through a dual-engine calculation process. By merging a 6-Tiered Pivot Architecture with a Validated Diagonal Scoring Engine, it provides a surgical view of market boundaries, allowing traders to distinguish between minor price fluctuations and major institutional walls.
*How the Engine Operates
This indicator functions as a mathematical filter for price action, operating on two distinct layers:
-1. Tiered Institutional Anchors (Horizontal)
Instead of looking at a single fractal period, V3 tracks six different "memory depths" simultaneously (ranging from 5 to 200 bars).
The Concept: Markets move in cycles. Small cycles (Pivot 1-2) represent retail positioning, while large cycles (Pivot 5-6) represent institutional buy/sell walls.
State-Aware Logic: Each level uses an ATR-Volatility Buffer to determine its current state. If price is above the level, it acts as Support (Green); if below, it is Resistance (Red). If price is currently slicing through it, the level turns Grey (Neutral), signaling a "No-Trade Zone" or a consolidation phase.
-2. Slope-Intercept Validation Engine (Diagonal)
The dynamic trendlines are not just simple "peak-to-peak" connectors. They are calculated using a Linear Regression Scoring System.
*The Concept: A trendline's strength is defined by its "cleanliness."
-The Filter: Unlike standard tools, V3 uses a Price-Action Scan. It calculates the path of a potential trendline and automatically discards it if it cuts through the bodies of intermediate candles. This ensures that the wedges and channels you see are statistically valid structural boundaries.
-Strategic Application: LTF vs. HTF
*Performance & User Manual
-Optimized Execution: V3 utilizes Last-Bar Offloading. It scans 1000+ bars of history in milliseconds by executing the heavy diagonal math only on the most recent candle, ensuring zero chart lag.
-Price Tags: Dynamic labels are pinned professionally above the levels. Use these as your Take-Profit (TP) or Stop-Loss (SL) targets.
-Customization: Adjust the Touch Tolerance in the settings to make the trendlines more or less strict depending on the asset's "wickiness" (e.g., higher for BTC, lower for Forex).
*Lower Timeframes (1m – 15m): Scalping & Intraday
-LTF Focus: Prioritize Pivot Levels 1, 2, and 3. These are highly reactive and will map the micro-pullbacks of the current session.
-Early Signal: Look for price to reject a Dynamic Trendline while a micro-pivot (Level 1) is acting as support. This provides an aggressive "Early Entry" with a very tight risk-to-reward ratio.
-The Trap: Avoid trading when the LTF candles are consistently Grey, as this indicates the market is trapped inside a static pivot zone.
-Higher Timeframes (1H – Daily): Swing & Position Trading
*HTF Focus: Prioritize Pivot Levels 5 and 6. These represent the "Major Floors and Ceilings" of the weekly or monthly trend.
-The Macro Wall: If price hits a Level 6 Pivot (200-bar lookback), expect a significant reaction. Institutional orders are often clustered at these depths.
-Structural Confluence: The most powerful HTF setup is "The Confluence Cross." This occurs when a diagonal Resistance Trendline and a horizontal Level 5/6 Resistance meet at the same price point. This is the mathematical "End of Trend" zone where heavy reversals typically begin.
! Notice: This tool is for institutional-grade structural mapping and educational purposes only. It is not financial advice. Structural levels are areas of high probability, not guaranteed reversal points. Always trade with a stop-loss.
Compared to the previous version, a completely new and accelerated concept.
Dynamic SRT V3 is a professional structural mapping suite that identifies high-density liquidity zones through a dual-engine calculation process. By merging a 6-Tiered Pivot Architecture with a Validated Diagonal Scoring Engine, it provides a surgical view of market boundaries, allowing traders to distinguish between minor price fluctuations and major institutional walls.
*How the Engine Operates
This indicator functions as a mathematical filter for price action, operating on two distinct layers:
-1. Tiered Institutional Anchors (Horizontal)
Instead of looking at a single fractal period, V3 tracks six different "memory depths" simultaneously (ranging from 5 to 200 bars).
The Concept: Markets move in cycles. Small cycles (Pivot 1-2) represent retail positioning, while large cycles (Pivot 5-6) represent institutional buy/sell walls.
State-Aware Logic: Each level uses an ATR-Volatility Buffer to determine its current state. If price is above the level, it acts as Support (Green); if below, it is Resistance (Red). If price is currently slicing through it, the level turns Grey (Neutral), signaling a "No-Trade Zone" or a consolidation phase.
-2. Slope-Intercept Validation Engine (Diagonal)
The dynamic trendlines are not just simple "peak-to-peak" connectors. They are calculated using a Linear Regression Scoring System.
*The Concept: A trendline's strength is defined by its "cleanliness."
-The Filter: Unlike standard tools, V3 uses a Price-Action Scan. It calculates the path of a potential trendline and automatically discards it if it cuts through the bodies of intermediate candles. This ensures that the wedges and channels you see are statistically valid structural boundaries.
-Strategic Application: LTF vs. HTF
*Performance & User Manual
-Optimized Execution: V3 utilizes Last-Bar Offloading. It scans 1000+ bars of history in milliseconds by executing the heavy diagonal math only on the most recent candle, ensuring zero chart lag.
-Price Tags: Dynamic labels are pinned professionally above the levels. Use these as your Take-Profit (TP) or Stop-Loss (SL) targets.
-Customization: Adjust the Touch Tolerance in the settings to make the trendlines more or less strict depending on the asset's "wickiness" (e.g., higher for BTC, lower for Forex).
*Lower Timeframes (1m – 15m): Scalping & Intraday
-LTF Focus: Prioritize Pivot Levels 1, 2, and 3. These are highly reactive and will map the micro-pullbacks of the current session.
-Early Signal: Look for price to reject a Dynamic Trendline while a micro-pivot (Level 1) is acting as support. This provides an aggressive "Early Entry" with a very tight risk-to-reward ratio.
-The Trap: Avoid trading when the LTF candles are consistently Grey, as this indicates the market is trapped inside a static pivot zone.
-Higher Timeframes (1H – Daily): Swing & Position Trading
*HTF Focus: Prioritize Pivot Levels 5 and 6. These represent the "Major Floors and Ceilings" of the weekly or monthly trend.
-The Macro Wall: If price hits a Level 6 Pivot (200-bar lookback), expect a significant reaction. Institutional orders are often clustered at these depths.
-Structural Confluence: The most powerful HTF setup is "The Confluence Cross." This occurs when a diagonal Resistance Trendline and a horizontal Level 5/6 Resistance meet at the same price point. This is the mathematical "End of Trend" zone where heavy reversals typically begin.
! Notice: This tool is for institutional-grade structural mapping and educational purposes only. It is not financial advice. Structural levels are areas of high probability, not guaranteed reversal points. Always trade with a stop-loss.
오픈 소스 스크립트
트레이딩뷰의 진정한 정신에 따라, 이 스크립트의 작성자는 이를 오픈소스로 공개하여 트레이더들이 기능을 검토하고 검증할 수 있도록 했습니다. 작성자에게 찬사를 보냅니다! 이 코드는 무료로 사용할 수 있지만, 코드를 재게시하는 경우 하우스 룰이 적용된다는 점을 기억하세요.

면책사항
해당 정보와 게시물은 금융, 투자, 트레이딩 또는 기타 유형의 조언이나 권장 사항으로 간주되지 않으며, 트레이딩뷰에서 제공하거나 보증하는 것이 아닙니다. 자세한 내용은 이용 약관을 참조하세요.
오픈 소스 스크립트
트레이딩뷰의 진정한 정신에 따라, 이 스크립트의 작성자는 이를 오픈소스로 공개하여 트레이더들이 기능을 검토하고 검증할 수 있도록 했습니다. 작성자에게 찬사를 보냅니다! 이 코드는 무료로 사용할 수 있지만, 코드를 재게시하는 경우 하우스 룰이 적용된다는 점을 기억하세요.
면책사항
해당 정보와 게시물은 금융, 투자, 트레이딩 또는 기타 유형의 조언이나 권장 사항으로 간주되지 않으며, 트레이딩뷰에서 제공하거나 보증하는 것이 아닙니다. 자세한 내용은 이용 약관을 참조하세요.