OPEN-SOURCE SCRIPT
PnL Target/Stop Calculator $100 - $2000
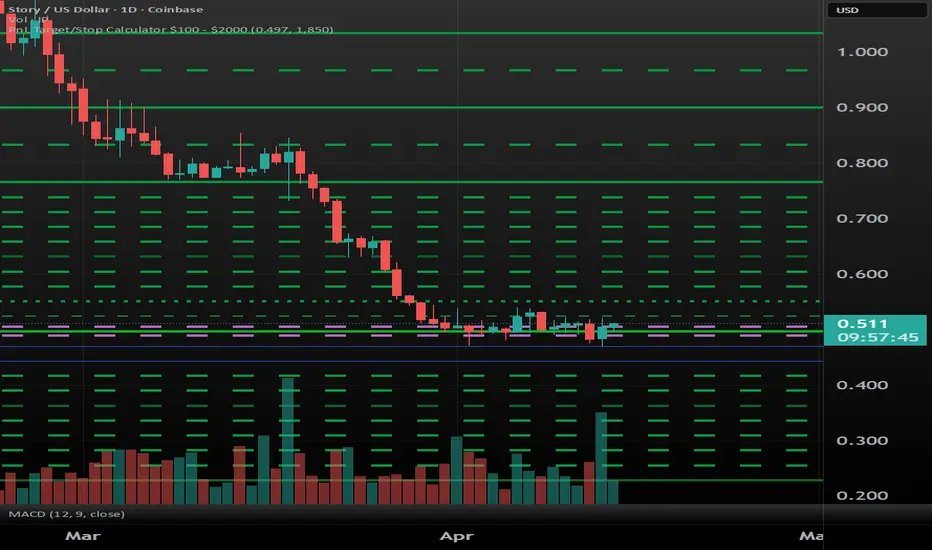
This tool plots gains and losses in $100 increments from $100 - $2000.
This can be used to find stop losses and targets based on PnL or to find the price where a specific loss or gain will occur at, and this is shown visually on chart with horizontal lines.
The user must define 2 values: The average entry price and how much is invested. This is done by going into the indicator's settings and clicking the Input tab.
Both entry and cash amount are used to determine where $100 increments of gain and loss are.
What's displayed?
- The brightest solid green line shows your entry.
- The skinniest dashed green line shows $100 loss/gain.
- The dotted green line shows $200 loss gain.
- It also contains a 1.6% stop, shown by the dashed purple lines.
- Solid green lines are $1000, $1500, and $2000.
After $1000 gain, the indicator shows gain in $250 increments up until $2000.
While PnL loss only goes up to $1000.
Here is how this is calculated:
$100 loss = [ (1-(100/cash)) * entry ].
$100 gain = [ (1+(100/cash)) * entry ]
$200 loss = [ (1-(200/cash)) * entry ].
$200 gain = [ (1+(200/cash)) * entry ]
...And so on.
To keep the horizontal lines after the indicator is removed, draw a horizontal ray or a horizontal line where the lines are drawn by the indicator and then remove the indicator after drawing the lines you wanted.
This can be used to find stop losses and targets based on PnL or to find the price where a specific loss or gain will occur at, and this is shown visually on chart with horizontal lines.
The user must define 2 values: The average entry price and how much is invested. This is done by going into the indicator's settings and clicking the Input tab.
Both entry and cash amount are used to determine where $100 increments of gain and loss are.
What's displayed?
- The brightest solid green line shows your entry.
- The skinniest dashed green line shows $100 loss/gain.
- The dotted green line shows $200 loss gain.
- It also contains a 1.6% stop, shown by the dashed purple lines.
- Solid green lines are $1000, $1500, and $2000.
After $1000 gain, the indicator shows gain in $250 increments up until $2000.
While PnL loss only goes up to $1000.
Here is how this is calculated:
$100 loss = [ (1-(100/cash)) * entry ].
$100 gain = [ (1+(100/cash)) * entry ]
$200 loss = [ (1-(200/cash)) * entry ].
$200 gain = [ (1+(200/cash)) * entry ]
...And so on.
To keep the horizontal lines after the indicator is removed, draw a horizontal ray or a horizontal line where the lines are drawn by the indicator and then remove the indicator after drawing the lines you wanted.
오픈 소스 스크립트
트레이딩뷰의 진정한 정신에 따라, 이 스크립트의 작성자는 이를 오픈소스로 공개하여 트레이더들이 기능을 검토하고 검증할 수 있도록 했습니다. 작성자에게 찬사를 보냅니다! 이 코드는 무료로 사용할 수 있지만, 코드를 재게시하는 경우 하우스 룰이 적용된다는 점을 기억하세요.

면책사항
해당 정보와 게시물은 금융, 투자, 트레이딩 또는 기타 유형의 조언이나 권장 사항으로 간주되지 않으며, 트레이딩뷰에서 제공하거나 보증하는 것이 아닙니다. 자세한 내용은 이용 약관을 참조하세요.
오픈 소스 스크립트
트레이딩뷰의 진정한 정신에 따라, 이 스크립트의 작성자는 이를 오픈소스로 공개하여 트레이더들이 기능을 검토하고 검증할 수 있도록 했습니다. 작성자에게 찬사를 보냅니다! 이 코드는 무료로 사용할 수 있지만, 코드를 재게시하는 경우 하우스 룰이 적용된다는 점을 기억하세요.
면책사항
해당 정보와 게시물은 금융, 투자, 트레이딩 또는 기타 유형의 조언이나 권장 사항으로 간주되지 않으며, 트레이딩뷰에서 제공하거나 보증하는 것이 아닙니다. 자세한 내용은 이용 약관을 참조하세요.