Volume Profile Levels - POC / Breakthrough Zone / Reversal Zone
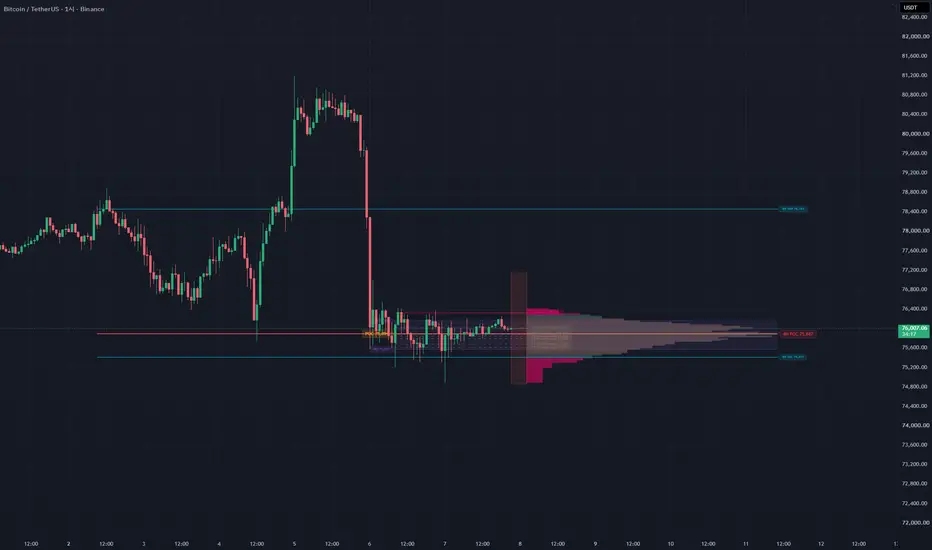
Volume Profile Levels - POC / Breakthrough Zone / Reversal Zone
🔹 Why v2
v1 drew levels using the common volume profile reading: high-volume areas act as support / resistance walls. Before building further on it, I tested that reading on BTC/USDT 1h (12,093 bars). It did not hold up. High-volume levels from a rolling profile held no more often than any thin band at the same distance, and price was not pulled toward the POC either. The data pointed the other way: thin areas tended to hold, thick areas tended to be passed through. v2 is rebuilt around what the test showed.
An anchored volume profile that starts at the most recent confirmed swing pivot and reads the profile the opposite way from the classic "high volume = wall" view: thin areas are marked as Reversal Zones (RZ), thick areas as Breakthrough Zones (TZ). A Path Gauge then measures how thick the profile is between the current price and your stop / target distance, separately for long and short.
━━━━━━━━━━━━━━━━━━━━━━━━
🔹 What Changed from v1
v1 used a rolling lookback, a mean baseline, and treated thick high-volume levels as support / resistance walls. This version changes all three, and adds two features.
1. Anchor: rolling lookback → last confirmed swing pivot
A rolling window shifts its start every bar, so the profile has no fixed reference. Anchoring to the last swing pivot measures the volume traded since the market's last turning point.
2. Baseline: mean → median
Mean = total volume ÷ bins, which includes near-empty bins. In a trend, a few bins take most of the volume and most of the range falls below the mean, so it is all labeled "low volume". Example from testing: with a 30-day lookback, 55.0% of bins fell below the mean but 31.7% below the median. The median keeps the classification stable.
3. Meaning: thick = wall → thick = breakthrough, thin = reversal
When every bin was ranked by thickness and grouped by distance from price, the share of touches that held fell steadily as bins got thicker, in every distance band tested (e.g. 0.9–1.4% away: thin bins held 52.8% of the time, very thick bins 39.4%).
Interpretation: thick = price spent time there = accepted price = price passes through. Thin = price moved through fast = rejected price = price tends to turn there.
That is why thin zones are drawn bright and thick zones faint — the colors look reversed compared to v1 on purpose.
4. New: Path Gauge (see below)
5. New: Multi-timeframe POC / Value Area lines (display only)
━━━━━━━━━━━━━━━━━━━━━━━━
🔹 How It Works
1. Anchor — finds the most recent swing pivot (high or low) confirmed with N bars on each side, at least "Min Anchor Distance" bars back. Pivots are confirmed only after N bars, so there is no look-ahead. If no pivot qualifies, it falls back to a fixed lookback.
2. Binning — splits the range from the anchor to the current bar into price bins and distributes each bar's volume evenly across the bins its high–low covers.
3. Baseline — median bin volume (or mean, optional).
4. Levels
• RZ Reversal Zone: a local low bin thinner than baseline × 0.80
• TZ Breakthrough Zone: a local peak bin thicker than baseline × 1.20
• POC and Value Area (default 70%), expanded from the POC toward the thicker neighbor
5. Path Gauge — average thickness (× baseline) of the bins between the current price and ±Bracket Width %:
• ≤ 0.80x → Clear (thin path)
• ≥ 1.20x → Hold (thick path)
• in between → Neutral
Coverage is shown too: when the bracket extends beyond the profile range, the verdict uses only the covered part and the table warns you.
In the author's study, average path thickness matched outcomes better than any single level. Long trades with a thin path above had a 55.0% win rate (n=318), normal 49.3% (n=367), thick 46.9% (n=326), and the ordering held after controlling for where price sat in the range.
The Path Gauge is a filter, not a signal: if the path in your trade direction is thick, consider holding off.
━━━━━━━━━━━━━━━━━━━━━━━━
🔹 How to Use
1. Add the indicator. The default settings are the configuration the thresholds were set for.
2. Set "Bracket Width %" to your typical SL / TP distance.
3. Read the path boxes next to price: green = Clear, red = Hold, gray = Neutral (upper box = long path, lower box = short path).
4. Use RZ lines as areas where price tends to react, and TZ lines as areas price tends to pass through.
5. Turn on "Verdict Table" for the full readout: anchor, range, position in range, baseline, POC, VA, path thickness and coverage.
━━━━━━━━━━━━━━━━━━━━━━━━
🔹 Alerts
Create the alert with the condition "Any alert() function call". Alerts fire on bar close for:
• Path verdict change (Long / Short)
• Close entering a Reversal Zone
• Close crossing a Breakthrough Zone up or down
• Entering / leaving the Value Area
━━━━━━━━━━━━━━━━━━━━━━━━
🔹 Settings
• Anchor: mode (pivot / rolling), pivot half-width, min / max anchor distance, fallback lookback, bins, Value Area %
• Baseline · Detection: median / mean, RZ and TZ thresholds, max levels shown
• Path Gauge: bracket width, Clear / Hold thresholds, path boxes
• Multi-Timeframe: adds POC / VAH / VAL of a selected timeframe, with its own color, width and style
• Display: profile side and width, histogram, POC, VA fill / lines, RZ, TZ, anchor line / label, labels, verdict table
• Colors, line widths and styles for every element
━━━━━━━━━━━━━━━━━━━━━━━━
🔹 Notes and Limitations
• Calculated on the last bar only, to stay within Pine's execution limits. Levels are not kept on past bars, so the indicator cannot be backtested on TradingView.
• The 0.80 / 1.20 thresholds were set for the default configuration. If you change the anchor mode, pivot width, baseline, bins or bracket width, the table shows a "Non-default Config" warning because the thickness distribution changes.
• Multi-timeframe lines are for reference only. Multi-timeframe agreement showed no measurable effect in testing, so they are not used by the Path Gauge or alerts.
• Support / resistance flips after a breakout were observed, but equally at thick and thin levels, so the indicator does not use them.
• All research figures come from a single market and timeframe (BTC/USDT 1h, 12,093 bars). Other symbols and timeframes may behave differently. Past behavior does not guarantee future results.
• For analysis and education only — not financial advice.
🔹 Why v2
v1 drew levels using the common volume profile reading: high-volume areas act as support / resistance walls. Before building further on it, I tested that reading on BTC/USDT 1h (12,093 bars). It did not hold up. High-volume levels from a rolling profile held no more often than any thin band at the same distance, and price was not pulled toward the POC either. The data pointed the other way: thin areas tended to hold, thick areas tended to be passed through. v2 is rebuilt around what the test showed.
An anchored volume profile that starts at the most recent confirmed swing pivot and reads the profile the opposite way from the classic "high volume = wall" view: thin areas are marked as Reversal Zones (RZ), thick areas as Breakthrough Zones (TZ). A Path Gauge then measures how thick the profile is between the current price and your stop / target distance, separately for long and short.
━━━━━━━━━━━━━━━━━━━━━━━━
🔹 What Changed from v1
v1 used a rolling lookback, a mean baseline, and treated thick high-volume levels as support / resistance walls. This version changes all three, and adds two features.
1. Anchor: rolling lookback → last confirmed swing pivot
A rolling window shifts its start every bar, so the profile has no fixed reference. Anchoring to the last swing pivot measures the volume traded since the market's last turning point.
2. Baseline: mean → median
Mean = total volume ÷ bins, which includes near-empty bins. In a trend, a few bins take most of the volume and most of the range falls below the mean, so it is all labeled "low volume". Example from testing: with a 30-day lookback, 55.0% of bins fell below the mean but 31.7% below the median. The median keeps the classification stable.
3. Meaning: thick = wall → thick = breakthrough, thin = reversal
When every bin was ranked by thickness and grouped by distance from price, the share of touches that held fell steadily as bins got thicker, in every distance band tested (e.g. 0.9–1.4% away: thin bins held 52.8% of the time, very thick bins 39.4%).
Interpretation: thick = price spent time there = accepted price = price passes through. Thin = price moved through fast = rejected price = price tends to turn there.
That is why thin zones are drawn bright and thick zones faint — the colors look reversed compared to v1 on purpose.
4. New: Path Gauge (see below)
5. New: Multi-timeframe POC / Value Area lines (display only)
━━━━━━━━━━━━━━━━━━━━━━━━
🔹 How It Works
1. Anchor — finds the most recent swing pivot (high or low) confirmed with N bars on each side, at least "Min Anchor Distance" bars back. Pivots are confirmed only after N bars, so there is no look-ahead. If no pivot qualifies, it falls back to a fixed lookback.
2. Binning — splits the range from the anchor to the current bar into price bins and distributes each bar's volume evenly across the bins its high–low covers.
3. Baseline — median bin volume (or mean, optional).
4. Levels
• RZ Reversal Zone: a local low bin thinner than baseline × 0.80
• TZ Breakthrough Zone: a local peak bin thicker than baseline × 1.20
• POC and Value Area (default 70%), expanded from the POC toward the thicker neighbor
5. Path Gauge — average thickness (× baseline) of the bins between the current price and ±Bracket Width %:
• ≤ 0.80x → Clear (thin path)
• ≥ 1.20x → Hold (thick path)
• in between → Neutral
Coverage is shown too: when the bracket extends beyond the profile range, the verdict uses only the covered part and the table warns you.
In the author's study, average path thickness matched outcomes better than any single level. Long trades with a thin path above had a 55.0% win rate (n=318), normal 49.3% (n=367), thick 46.9% (n=326), and the ordering held after controlling for where price sat in the range.
The Path Gauge is a filter, not a signal: if the path in your trade direction is thick, consider holding off.
━━━━━━━━━━━━━━━━━━━━━━━━
🔹 How to Use
1. Add the indicator. The default settings are the configuration the thresholds were set for.
2. Set "Bracket Width %" to your typical SL / TP distance.
3. Read the path boxes next to price: green = Clear, red = Hold, gray = Neutral (upper box = long path, lower box = short path).
4. Use RZ lines as areas where price tends to react, and TZ lines as areas price tends to pass through.
5. Turn on "Verdict Table" for the full readout: anchor, range, position in range, baseline, POC, VA, path thickness and coverage.
━━━━━━━━━━━━━━━━━━━━━━━━
🔹 Alerts
Create the alert with the condition "Any alert() function call". Alerts fire on bar close for:
• Path verdict change (Long / Short)
• Close entering a Reversal Zone
• Close crossing a Breakthrough Zone up or down
• Entering / leaving the Value Area
━━━━━━━━━━━━━━━━━━━━━━━━
🔹 Settings
• Anchor: mode (pivot / rolling), pivot half-width, min / max anchor distance, fallback lookback, bins, Value Area %
• Baseline · Detection: median / mean, RZ and TZ thresholds, max levels shown
• Path Gauge: bracket width, Clear / Hold thresholds, path boxes
• Multi-Timeframe: adds POC / VAH / VAL of a selected timeframe, with its own color, width and style
• Display: profile side and width, histogram, POC, VA fill / lines, RZ, TZ, anchor line / label, labels, verdict table
• Colors, line widths and styles for every element
━━━━━━━━━━━━━━━━━━━━━━━━
🔹 Notes and Limitations
• Calculated on the last bar only, to stay within Pine's execution limits. Levels are not kept on past bars, so the indicator cannot be backtested on TradingView.
• The 0.80 / 1.20 thresholds were set for the default configuration. If you change the anchor mode, pivot width, baseline, bins or bracket width, the table shows a "Non-default Config" warning because the thickness distribution changes.
• Multi-timeframe lines are for reference only. Multi-timeframe agreement showed no measurable effect in testing, so they are not used by the Path Gauge or alerts.
• Support / resistance flips after a breakout were observed, but equally at thick and thin levels, so the indicator does not use them.
• All research figures come from a single market and timeframe (BTC/USDT 1h, 12,093 bars). Other symbols and timeframes may behave differently. Past behavior does not guarantee future results.
• For analysis and education only — not financial advice.

면책사항
해당 정보와 게시물은 금융, 투자, 트레이딩 또는 기타 유형의 조언이나 권장 사항으로 간주되지 않으며, 트레이딩뷰에서 제공하거나 보증하는 것이 아닙니다. 자세한 내용은 이용 약관을 참조하세요.
면책사항
해당 정보와 게시물은 금융, 투자, 트레이딩 또는 기타 유형의 조언이나 권장 사항으로 간주되지 않으며, 트레이딩뷰에서 제공하거나 보증하는 것이 아닙니다. 자세한 내용은 이용 약관을 참조하세요.