Fakeout & Swing High/Low Signals [JPT]
🔷 OVERVIEW
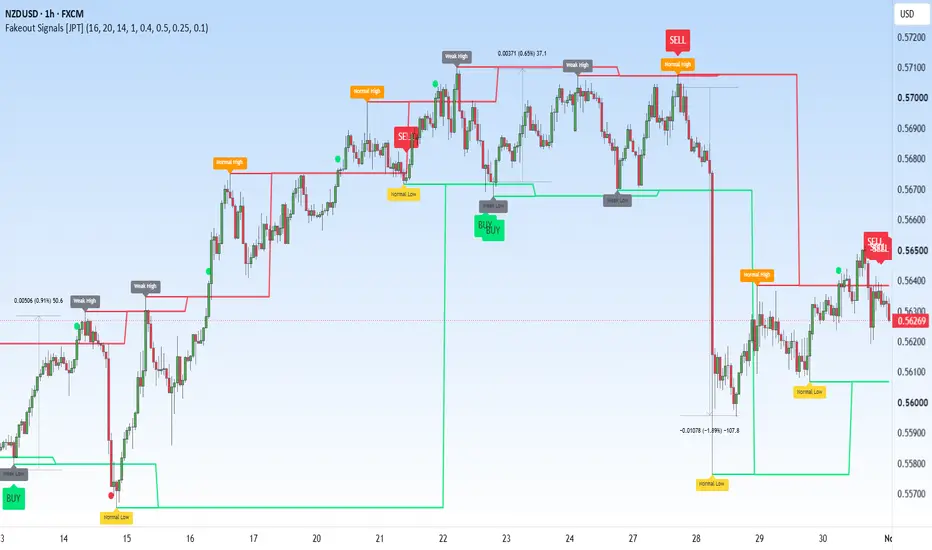
Fakeout & Swing High/Low Signals [JPT] is a technical analysis indicator designed to identify confirmed swing highs, swing lows, market structure breaks, and potential fake breakout reversals.
The indicator analyzes price action using pivot detection, ATR-based swing strength, and candle wick/body characteristics to classify important market turning points.
It helps traders understand where price may be collecting liquidity, breaking important levels, or rejecting previous swing areas.
🔷 FEATURES
▶ Swing High & Low Detection: Identifies confirmed market swing points using configurable pivot strength.
▶ Swing Strength Classification: Categorizes swing points into Strong, Normal, and Weak Highs/Lows.
▶ Dynamic Swing Levels: Displays horizontal support and resistance levels.
▶ Breakout Detection: Highlights bullish and bearish breaks of previous swing levels.
▶ Fake Breakout Detection: Identifies potential liquidity sweeps when price breaks a swing level but closes back inside it.
▶ Bullish Reversal Signals: Displays BUY markers after a confirmed sweep below a swing low and reclaim.
▶ Bearish Reversal Signals: Displays SELL markers after a confirmed sweep above a swing high and rejection.
▶ ATR Sweep Filter: Provides an optional minimum sweep-distance filter.
▶ Customizable Visuals: Allows users to configure labels, levels, markers, and alerts.
🔷 HOW IT WORKS
1. Swing Detection
The indicator uses confirmed pivot highs and pivot lows to identify important price turning points. Pivot Strength determines how many candles are required on each side for confirmation.
2. Swing Strength Analysis
Each confirmed swing is evaluated using three conditions:
Distance from the previous swing compared with ATR.
Upper or lower wick percentage.
Candle body percentage.
Based on these conditions, the indicator classifies swings as Strong, Normal, or Weak.
3. Breakout Detection
A bullish breakout is identified when price closes above the latest confirmed swing high.
A bearish breakout is identified when price closes below the latest confirmed swing low.
4. Fake Breakout Detection
A bullish fake breakout occurs when price moves below a confirmed swing low but closes back above that level.
A bearish fake breakout occurs when price moves above a confirmed swing high but closes back below that level.
Additional wick, candle-color, and ATR filters can be used to refine these conditions.
🔷 HOW TO USE
Add the indicator to your TradingView chart.
Identify confirmed Strong, Normal, and Weak swing points.
Monitor the horizontal swing levels as potential liquidity areas.
Watch for price breaking above or below important swing levels.
Look for BUY or SELL signals when price sweeps a swing level and closes back inside.
Use additional market structure, trend direction, and price-action confirmation before considering an entry.
Configure alerts to monitor potential breakout and reversal conditions.
🔷 IMPORTANT NOTE
This indicator is designed for educational and technical analysis purposes.
Swing points require confirmation candles, meaning they appear only after the selected Pivot Strength period has completed.
Fake breakout signals are based on candle-close conditions and do not guarantee a market reversal. A liquidity sweep alone should not be treated as an automatic trading entry.
Always combine signals with proper market analysis, stop-loss placement, and risk management.
Developed by Jos-ProTrader [JPT].
Fakeout & Swing High/Low Signals [JPT] is a technical analysis indicator designed to identify confirmed swing highs, swing lows, market structure breaks, and potential fake breakout reversals.
The indicator analyzes price action using pivot detection, ATR-based swing strength, and candle wick/body characteristics to classify important market turning points.
It helps traders understand where price may be collecting liquidity, breaking important levels, or rejecting previous swing areas.
🔷 FEATURES
▶ Swing High & Low Detection: Identifies confirmed market swing points using configurable pivot strength.
▶ Swing Strength Classification: Categorizes swing points into Strong, Normal, and Weak Highs/Lows.
▶ Dynamic Swing Levels: Displays horizontal support and resistance levels.
▶ Breakout Detection: Highlights bullish and bearish breaks of previous swing levels.
▶ Fake Breakout Detection: Identifies potential liquidity sweeps when price breaks a swing level but closes back inside it.
▶ Bullish Reversal Signals: Displays BUY markers after a confirmed sweep below a swing low and reclaim.
▶ Bearish Reversal Signals: Displays SELL markers after a confirmed sweep above a swing high and rejection.
▶ ATR Sweep Filter: Provides an optional minimum sweep-distance filter.
▶ Customizable Visuals: Allows users to configure labels, levels, markers, and alerts.
🔷 HOW IT WORKS
1. Swing Detection
The indicator uses confirmed pivot highs and pivot lows to identify important price turning points. Pivot Strength determines how many candles are required on each side for confirmation.
2. Swing Strength Analysis
Each confirmed swing is evaluated using three conditions:
Distance from the previous swing compared with ATR.
Upper or lower wick percentage.
Candle body percentage.
Based on these conditions, the indicator classifies swings as Strong, Normal, or Weak.
3. Breakout Detection
A bullish breakout is identified when price closes above the latest confirmed swing high.
A bearish breakout is identified when price closes below the latest confirmed swing low.
4. Fake Breakout Detection
A bullish fake breakout occurs when price moves below a confirmed swing low but closes back above that level.
A bearish fake breakout occurs when price moves above a confirmed swing high but closes back below that level.
Additional wick, candle-color, and ATR filters can be used to refine these conditions.
🔷 HOW TO USE
Add the indicator to your TradingView chart.
Identify confirmed Strong, Normal, and Weak swing points.
Monitor the horizontal swing levels as potential liquidity areas.
Watch for price breaking above or below important swing levels.
Look for BUY or SELL signals when price sweeps a swing level and closes back inside.
Use additional market structure, trend direction, and price-action confirmation before considering an entry.
Configure alerts to monitor potential breakout and reversal conditions.
🔷 IMPORTANT NOTE
This indicator is designed for educational and technical analysis purposes.
Swing points require confirmation candles, meaning they appear only after the selected Pivot Strength period has completed.
Fake breakout signals are based on candle-close conditions and do not guarantee a market reversal. A liquidity sweep alone should not be treated as an automatic trading entry.
Always combine signals with proper market analysis, stop-loss placement, and risk management.
Developed by Jos-ProTrader [JPT].

📈 FREE TELEGRAM CHANNEL
🥇 Free Daily Forex, Gold & BTC Trade Signals
📚 Daily Trading Lessons & Technical Analysis
Learn, improve, and follow the market with us — completely FREE.
📲 Join Now: t.me/JosProTrader_050
🥇 Free Daily Forex, Gold & BTC Trade Signals
📚 Daily Trading Lessons & Technical Analysis
Learn, improve, and follow the market with us — completely FREE.
📲 Join Now: t.me/JosProTrader_050
면책사항
해당 정보와 게시물은 금융, 투자, 트레이딩 또는 기타 유형의 조언이나 권장 사항으로 간주되지 않으며, 트레이딩뷰에서 제공하거나 보증하는 것이 아닙니다. 자세한 내용은 이용 약관을 참조하세요.
📈 FREE TELEGRAM CHANNEL
🥇 Free Daily Forex, Gold & BTC Trade Signals
📚 Daily Trading Lessons & Technical Analysis
Learn, improve, and follow the market with us — completely FREE.
📲 Join Now: t.me/JosProTrader_050
🥇 Free Daily Forex, Gold & BTC Trade Signals
📚 Daily Trading Lessons & Technical Analysis
Learn, improve, and follow the market with us — completely FREE.
📲 Join Now: t.me/JosProTrader_050
면책사항
해당 정보와 게시물은 금융, 투자, 트레이딩 또는 기타 유형의 조언이나 권장 사항으로 간주되지 않으며, 트레이딩뷰에서 제공하거나 보증하는 것이 아닙니다. 자세한 내용은 이용 약관을 참조하세요.