NQ Weekly Globex Volume Profile
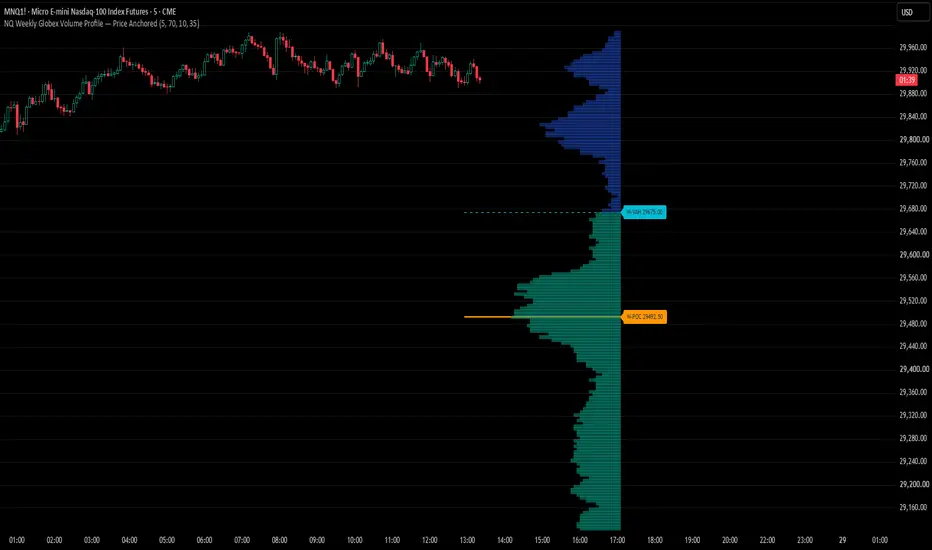
NQ Weekly Globex Volume Profile
## Overview
The **NQ Weekly Globex Volume Profile — Price Anchored** is a TradingView indicator designed to visualise the distribution of trading volume across price levels throughout the weekly Globex session.
Built with Nasdaq futures traders in mind, the indicator displays a horizontal volume profile anchored to actual price levels on the chart, helping traders identify areas of high and low trading activity and important weekly reference levels.
The profile resets at **6:00 PM New York time on Sunday**, marking the start of the new Globex trading week.
## Key Features
**Weekly Globex Volume Profile**
- Accumulates volume by price level throughout the trading week.
- Resets automatically at the Sunday 6:00 PM New York Globex open.
- Displays the profile to the right of the chart for easier analysis.
**Point of Control (POC)**
- Highlights the price row with the highest accumulated volume.
- Provides a key reference level for analysing price acceptance and potential reactions.
**Value Area High (VAH) and Value Area Low (VAL)**
- Calculates the value area using a configurable percentage of total accumulated volume.
- Defaults to 70% of the profile's volume.
- Displays the upper and lower boundaries of the calculated value area.
**Price-Anchored Profile**
- Draws profile rows at their corresponding price levels.
- Keeps the profile visually aligned with market prices rather than using a floating, screen-positioned histogram.
**Customisation**
- Adjustable price-per-row size, with a default of 5 NQ points.
- Configurable value area percentage.
- Adjustable profile width and distance from the latest bar.
- Separate colours for the volume profile, value area, POC and VAH/VAL.
- Option to hide volume outside the value area.
- Optional price labels for the POC, VAH and VAL.
## How Traders Can Use It
The indicator can be used as part of a broader futures trading approach to:
- Identify the weekly Point of Control as a potential area of price acceptance.
- Monitor reactions around the weekly VAH and VAL.
- Assess whether price is trading inside or outside the current weekly value area.
- Identify potential support, resistance and mean-reversion reference levels.
- Combine volume-profile levels with market structure, VWAP, liquidity sweeps, breakouts and other price-action techniques.
These levels are references for analysis, not guaranteed support or resistance. Traders should use additional confirmation and appropriate risk management.
## Important Calculation Note
This indicator builds an **approximate volume-at-price distribution** by dividing each chart candle's reported volume equally across the price rows touched by that candle. It does not use exchange-level trade-by-trade volume-at-price data.
Consequently, the profile may differ from TradingView's native Volume Profile tools or other profiles built from lower-timeframe or tick-level data. Accuracy and detail can also vary with the chart timeframe and data feed.
## Recommended Use
Designed primarily for **Nasdaq futures (NQ and MNQ)**, although it can be applied to other instruments. The default row size is 5 price points, so adjust it to suit the instrument, timeframe and level of detail required.
This indicator is intended as an analytical tool and does not generate buy or sell recommendations.
**Disclaimer:** For educational and informational purposes only. This indicator is not financial advice. Trading futures involves substantial risk.
## Overview
The **NQ Weekly Globex Volume Profile — Price Anchored** is a TradingView indicator designed to visualise the distribution of trading volume across price levels throughout the weekly Globex session.
Built with Nasdaq futures traders in mind, the indicator displays a horizontal volume profile anchored to actual price levels on the chart, helping traders identify areas of high and low trading activity and important weekly reference levels.
The profile resets at **6:00 PM New York time on Sunday**, marking the start of the new Globex trading week.
## Key Features
**Weekly Globex Volume Profile**
- Accumulates volume by price level throughout the trading week.
- Resets automatically at the Sunday 6:00 PM New York Globex open.
- Displays the profile to the right of the chart for easier analysis.
**Point of Control (POC)**
- Highlights the price row with the highest accumulated volume.
- Provides a key reference level for analysing price acceptance and potential reactions.
**Value Area High (VAH) and Value Area Low (VAL)**
- Calculates the value area using a configurable percentage of total accumulated volume.
- Defaults to 70% of the profile's volume.
- Displays the upper and lower boundaries of the calculated value area.
**Price-Anchored Profile**
- Draws profile rows at their corresponding price levels.
- Keeps the profile visually aligned with market prices rather than using a floating, screen-positioned histogram.
**Customisation**
- Adjustable price-per-row size, with a default of 5 NQ points.
- Configurable value area percentage.
- Adjustable profile width and distance from the latest bar.
- Separate colours for the volume profile, value area, POC and VAH/VAL.
- Option to hide volume outside the value area.
- Optional price labels for the POC, VAH and VAL.
## How Traders Can Use It
The indicator can be used as part of a broader futures trading approach to:
- Identify the weekly Point of Control as a potential area of price acceptance.
- Monitor reactions around the weekly VAH and VAL.
- Assess whether price is trading inside or outside the current weekly value area.
- Identify potential support, resistance and mean-reversion reference levels.
- Combine volume-profile levels with market structure, VWAP, liquidity sweeps, breakouts and other price-action techniques.
These levels are references for analysis, not guaranteed support or resistance. Traders should use additional confirmation and appropriate risk management.
## Important Calculation Note
This indicator builds an **approximate volume-at-price distribution** by dividing each chart candle's reported volume equally across the price rows touched by that candle. It does not use exchange-level trade-by-trade volume-at-price data.
Consequently, the profile may differ from TradingView's native Volume Profile tools or other profiles built from lower-timeframe or tick-level data. Accuracy and detail can also vary with the chart timeframe and data feed.
## Recommended Use
Designed primarily for **Nasdaq futures (NQ and MNQ)**, although it can be applied to other instruments. The default row size is 5 price points, so adjust it to suit the instrument, timeframe and level of detail required.
This indicator is intended as an analytical tool and does not generate buy or sell recommendations.
**Disclaimer:** For educational and informational purposes only. This indicator is not financial advice. Trading futures involves substantial risk.

면책사항
해당 정보와 게시물은 금융, 투자, 트레이딩 또는 기타 유형의 조언이나 권장 사항으로 간주되지 않으며, 트레이딩뷰에서 제공하거나 보증하는 것이 아닙니다. 자세한 내용은 이용 약관을 참조하세요.
면책사항
해당 정보와 게시물은 금융, 투자, 트레이딩 또는 기타 유형의 조언이나 권장 사항으로 간주되지 않으며, 트레이딩뷰에서 제공하거나 보증하는 것이 아닙니다. 자세한 내용은 이용 약관을 참조하세요.