OPEN-SOURCE SCRIPT
AK - DCA Calculator
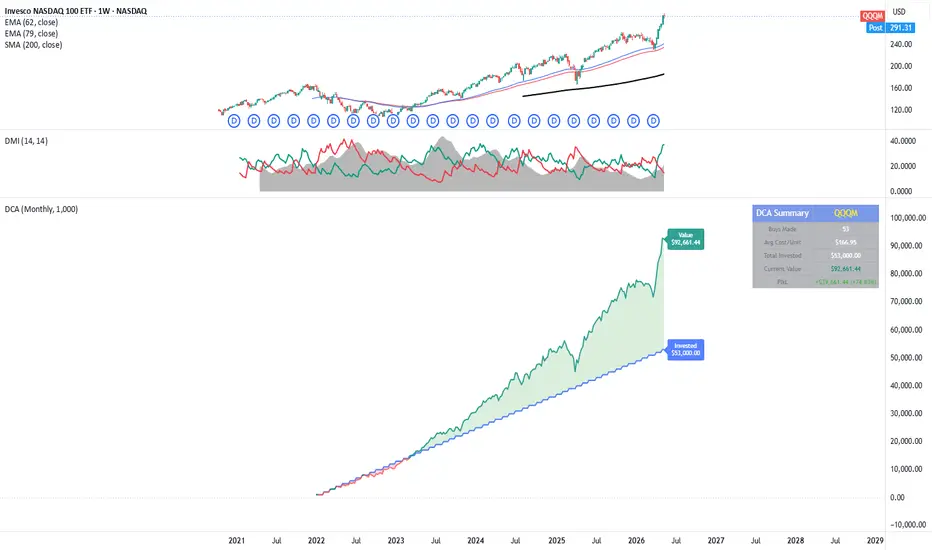
This indicator visualizes your Dollar Cost Averaging (DCA) strategy directly on your chart — no backtesting, no strategy tester, just a clean plot showing exactly where your money stands today.
What it does
Set your start date, buy frequency, and investment amount — the indicator calculates how many units you would have accumulated through consistent DCA purchases, then plots your total invested capital against your current portfolio value in a separate pane below the chart.
Features
📅 Configurable start date — model your DCA from any point in history
🔁 Three buy frequencies — Daily, Weekly, or Monthly
💵 Custom investment amount per purchase
📊 Separate pane — does not clutter your main price chart
🟢 Green fill when you're in profit, red fill when underwater
🏷️ Live labels on the last bar showing exact invested vs. current value
📋 Summary table (top-right) showing: buys made, average cost per unit, total invested, current portfolio value, and P&L in both $ and %
🎨 Fully customizable colors for all plot elements
How to use
Add the indicator to any ticker
Open Settings and set your Start Date, Buy Frequency, and Amount per Purchase
Best used on a Daily or Weekly chart for accurate frequency simulation
Works on any asset — stocks, crypto, forex, indices.
What it does
Set your start date, buy frequency, and investment amount — the indicator calculates how many units you would have accumulated through consistent DCA purchases, then plots your total invested capital against your current portfolio value in a separate pane below the chart.
Features
📅 Configurable start date — model your DCA from any point in history
🔁 Three buy frequencies — Daily, Weekly, or Monthly
💵 Custom investment amount per purchase
📊 Separate pane — does not clutter your main price chart
🟢 Green fill when you're in profit, red fill when underwater
🏷️ Live labels on the last bar showing exact invested vs. current value
📋 Summary table (top-right) showing: buys made, average cost per unit, total invested, current portfolio value, and P&L in both $ and %
🎨 Fully customizable colors for all plot elements
How to use
Add the indicator to any ticker
Open Settings and set your Start Date, Buy Frequency, and Amount per Purchase
Best used on a Daily or Weekly chart for accurate frequency simulation
Works on any asset — stocks, crypto, forex, indices.
오픈 소스 스크립트
트레이딩뷰의 진정한 정신에 따라, 이 스크립트의 작성자는 이를 오픈소스로 공개하여 트레이더들이 기능을 검토하고 검증할 수 있도록 했습니다. 작성자에게 찬사를 보냅니다! 이 코드는 무료로 사용할 수 있지만, 코드를 재게시하는 경우 하우스 룰이 적용된다는 점을 기억하세요.

면책사항
해당 정보와 게시물은 금융, 투자, 트레이딩 또는 기타 유형의 조언이나 권장 사항으로 간주되지 않으며, 트레이딩뷰에서 제공하거나 보증하는 것이 아닙니다. 자세한 내용은 이용 약관을 참조하세요.
오픈 소스 스크립트
트레이딩뷰의 진정한 정신에 따라, 이 스크립트의 작성자는 이를 오픈소스로 공개하여 트레이더들이 기능을 검토하고 검증할 수 있도록 했습니다. 작성자에게 찬사를 보냅니다! 이 코드는 무료로 사용할 수 있지만, 코드를 재게시하는 경우 하우스 룰이 적용된다는 점을 기억하세요.
면책사항
해당 정보와 게시물은 금융, 투자, 트레이딩 또는 기타 유형의 조언이나 권장 사항으로 간주되지 않으며, 트레이딩뷰에서 제공하거나 보증하는 것이 아닙니다. 자세한 내용은 이용 약관을 참조하세요.