OPEN-SOURCE SCRIPT
업데이트됨 DVOL/(UVOL+DVOL) 5min INTRADAY
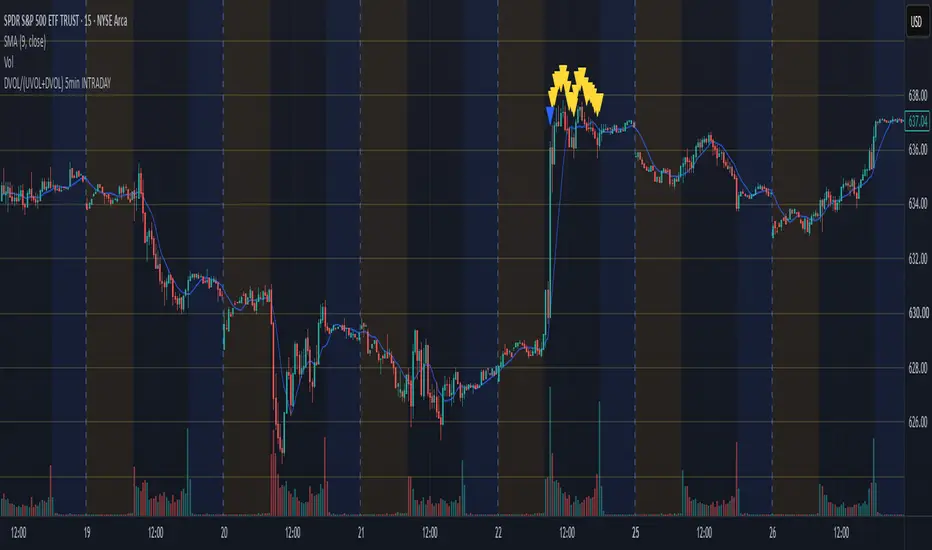
Overview:
This indicator tracks broad US market volume breadth in real-time to identify extreme intraday volume imbalances. By comparing Down Volume (USI:DVOL) against total volume (UVOL + DVOL) on a 5-minute timeframe, it pinpoints moments of aggressive market-wide buying and selling pressure that often signal intraday exhaustion points, reversals, or momentum continuation.
How It Works
The script calculates the ratio of declining volume against total market volume on every 5-minute candle:
Down Volume Ratio = DVOL / (UVOL+DVOL)
Extreme Down-Volume / Selling Pressure >= 89.9%
Triggers when down volume accounts for 89.9% or more of all traded volume across US markets. This often marks extreme panic selling or capitulation.
Extreme Up-Volume / Buying Pressure <= 9.9%
Triggers when down volume is under 10 (meaning Up Volume is 90%+).This marks broad-based market buying frenzies.
🟠 Orange Triangle (Below Bar) — Single High Threshold:
First occurrence of extreme market selling volume (≥89.9)
🟣 Purple Triangle (Below Bar) — Repeated High Threshold:
Extreme selling volume triggered when the condition has already appeared 2 or more times over the past 3 days (clustered selling pressure).
🔵 Blue Triangle (Above Bar) — Single Low Threshold:
First occurrence of extreme market buying volume (≤9.9%)
🟡 Yellow Triangle (Above Bar) — Repeated Low Threshold:
Extreme buying volume triggered when the condition has appeared 2 or more times over the past 3 days (clustered buying pressure).
Built-in Webhook & JSON Alerts
Whenever any single or repeated volume threshold is met, the indicator triggers a ready-to-use JSON alert payload (firing once per bar):
JSON:
{"text": "Trading Signal: Intraday SCALPING ONLY Short-Term trade SPY Triggered at [Price] Ticker [Ticker] Chart [Timeframe]"}
This is ideal for automated execution, Discord/Telegram webhooks, or alert routing.
This is designed specifically for SPY , SP500 indices , ES_F1! on a intraday timeframe and for intraday trading only.
This indicator tracks broad US market volume breadth in real-time to identify extreme intraday volume imbalances. By comparing Down Volume (USI:DVOL) against total volume (UVOL + DVOL) on a 5-minute timeframe, it pinpoints moments of aggressive market-wide buying and selling pressure that often signal intraday exhaustion points, reversals, or momentum continuation.
How It Works
The script calculates the ratio of declining volume against total market volume on every 5-minute candle:
Down Volume Ratio = DVOL / (UVOL+DVOL)
Extreme Down-Volume / Selling Pressure >= 89.9%
Triggers when down volume accounts for 89.9% or more of all traded volume across US markets. This often marks extreme panic selling or capitulation.
Extreme Up-Volume / Buying Pressure <= 9.9%
Triggers when down volume is under 10 (meaning Up Volume is 90%+).This marks broad-based market buying frenzies.
🟠 Orange Triangle (Below Bar) — Single High Threshold:
First occurrence of extreme market selling volume (≥89.9)
🟣 Purple Triangle (Below Bar) — Repeated High Threshold:
Extreme selling volume triggered when the condition has already appeared 2 or more times over the past 3 days (clustered selling pressure).
🔵 Blue Triangle (Above Bar) — Single Low Threshold:
First occurrence of extreme market buying volume (≤9.9%)
🟡 Yellow Triangle (Above Bar) — Repeated Low Threshold:
Extreme buying volume triggered when the condition has appeared 2 or more times over the past 3 days (clustered buying pressure).
Built-in Webhook & JSON Alerts
Whenever any single or repeated volume threshold is met, the indicator triggers a ready-to-use JSON alert payload (firing once per bar):
JSON:
{"text": "Trading Signal: Intraday SCALPING ONLY Short-Term trade SPY Triggered at [Price] Ticker [Ticker] Chart [Timeframe]"}
This is ideal for automated execution, Discord/Telegram webhooks, or alert routing.
This is designed specifically for
SPY , SP500 indices , ES_F1! on a intraday timeframe and for intraday trading only. 릴리즈 노트
Overview:This indicator tracks broad US market volume breadth in real-time to identify extreme intraday volume imbalances. By comparing Down Volume (USI:DVOL) against total volume (UVOL + DVOL) on a 5-minute timeframe, it pinpoints moments of aggressive market-wide buying and selling pressure that often signal intraday exhaustion points, reversals, or momentum continuation.
How It Works
The script calculates the ratio of declining volume against total market volume on every 5-minute candle:
Down Volume Ratio = DVOL / (UVOL+DVOL)
Extreme Down-Volume / Selling Pressure >= 89.9%
Triggers when down volume accounts for 89.9% or more of all traded volume across US markets. This often marks extreme panic selling or capitulation.
Extreme Up-Volume / Buying Pressure <= 9.9%
Triggers when down volume is under 10 (meaning Up Volume is 90%+).This marks broad-based market buying frenzies.
🟠 Orange Triangle (Below Bar) — Single High Threshold:
First occurrence of extreme market selling volume (≥89.9)
🟣 Purple Triangle (Below Bar) — Repeated High Threshold:
Extreme selling volume triggered when the condition has already appeared 2 or more times over the past 3 days (clustered selling pressure).
🔵 Blue Triangle (Above Bar) — Single Low Threshold:
First occurrence of extreme market buying volume (≤9.9%)
🟡 Yellow Triangle (Above Bar) — Repeated Low Threshold:
Extreme buying volume triggered when the condition has appeared 2 or more times over the past 3 days (clustered buying pressure).
Built-in Webhook & JSON Alerts
Whenever any single or repeated volume threshold is met, the indicator triggers a ready-to-use JSON alert payload (firing once per bar):
JSON:
{"text": "Trading Signal: Intraday SCALPING ONLY Short-Term trade SPY Triggered at [Price] Ticker [Ticker] Chart [Timeframe]"}
This is ideal for automated execution, Discord/Telegram webhooks, or alert routing.
This is designed specifically for
SPY
, SP500 indices , ES_F1! on a intraday timeframe and for intraday trading only.
릴리즈 노트
V3 Fixed a bug where the signal triggers prematurely at the day's opening print
오픈 소스 스크립트
트레이딩뷰의 진정한 정신에 따라, 이 스크립트의 작성자는 이를 오픈소스로 공개하여 트레이더들이 기능을 검토하고 검증할 수 있도록 했습니다. 작성자에게 찬사를 보냅니다! 이 코드는 무료로 사용할 수 있지만, 코드를 재게시하는 경우 하우스 룰이 적용된다는 점을 기억하세요.

면책사항
해당 정보와 게시물은 금융, 투자, 트레이딩 또는 기타 유형의 조언이나 권장 사항으로 간주되지 않으며, 트레이딩뷰에서 제공하거나 보증하는 것이 아닙니다. 자세한 내용은 이용 약관을 참조하세요.
오픈 소스 스크립트
트레이딩뷰의 진정한 정신에 따라, 이 스크립트의 작성자는 이를 오픈소스로 공개하여 트레이더들이 기능을 검토하고 검증할 수 있도록 했습니다. 작성자에게 찬사를 보냅니다! 이 코드는 무료로 사용할 수 있지만, 코드를 재게시하는 경우 하우스 룰이 적용된다는 점을 기억하세요.
면책사항
해당 정보와 게시물은 금융, 투자, 트레이딩 또는 기타 유형의 조언이나 권장 사항으로 간주되지 않으며, 트레이딩뷰에서 제공하거나 보증하는 것이 아닙니다. 자세한 내용은 이용 약관을 참조하세요.