OPEN-SOURCE SCRIPT
ORB + FVG - FIB Dashboard & Multi-TF Confluences [Improved]
Advanced ORB + ICT PD-Array Confluence System [15m]
This institutional-grade breakout indicator is designed specifically for high-precision trading on indices like QQQ, SPY, and NQ. It combines the power of the 15-Minute Opening Range Breakout (ORB) with ICT PD Arrays (Fair Value Gaps & Order Blocks) and a sophisticated multi-factor confluence engine.
Unlike standard breakout indicators, this system requires price action to prove itself through institutional momentum (FVGs) and structural retests (Fibonacci Pullbacks) before issuing a signal.
🧠 Core Methodology
1. The 15-Minute Opening Range
The script automatically captures the high and low of the first 15 minutes of the New York session (09:30–09:45). These levels act as the "Battleground" for the rest of the day.
2. Institutional PD Arrays (FVG & OB)
The indicator identifies and tracks Fair Value Gaps (+/-FVG) and Order Blocks (+/-OB) using standard ICT logic.
Internal FVGs: Identifies institutional buildup inside the range before the snap.
External FVGs: Confirms institutional displacement beyond the range during the breakout.
Persistent Tracking: Boxes extend to the right automatically and are removed only when the gap is "filled" by price action.
3. Multi-Factor Confluence Dashboard
The real-time dashboard monitors 9 unique confluences to give you a "Strength Score" out of 9:
Volume & RSI: Momentum and relative strength confirmation.
MACD & EMA Cross: Trend alignment.
4H EMA: Higher Timeframe (HTF) trend filtering.
Fibonacci Pullback: Option to require a pullback to the .382, .500, or .618 levels before signal confirmation (preventing "chasing" the move).
📊 Performance Dashboard
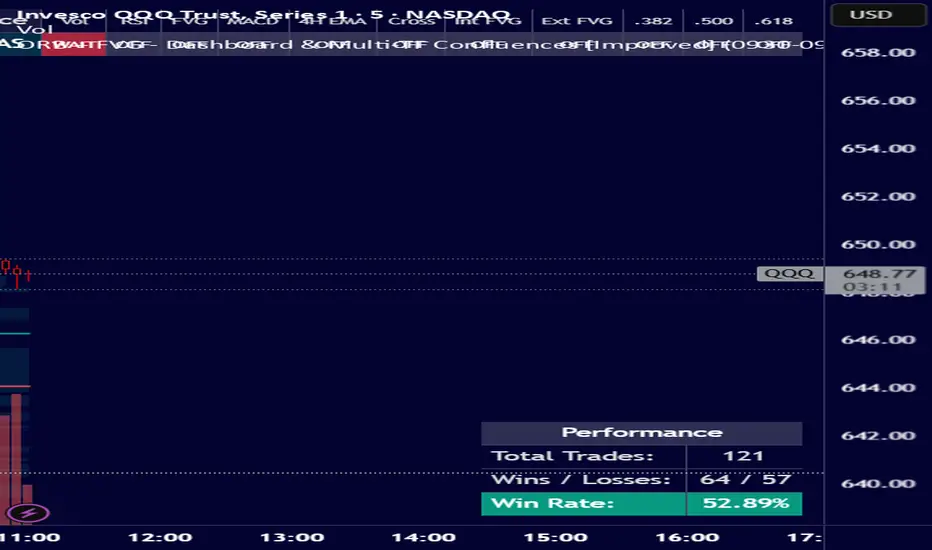
Stop guessing which confluences work best. The built-in Performance Dashboard tracks:
Total Trades: Every signal fired within your chosen date range.
Win/Loss Record: Based on a strict 1:1 Risk/Reward logic (opposite range side as SL).
Win Rate %: Updates in real-time as you toggle confluences on or off, allowing you to find the "Sweet Spot" for the current market regime.
🛠 How to Trade This System
Establish the Range: Wait for the 15-minute box to form at the NY Open.
Monitor the Bias: The dashboard will show Long or Short Bias based on price relation to the range midline.
Check Confluences: Look for a Strength Score of 7/9 or higher.
The Retest: If enabled, wait for the price to tap the chosen Fibonacci level after the breakout.
Entry: Execute on the BUY/SELL or FLIP labels.
Exit: The script prints a clear ORANGE EXIT label when the 9/20 EMA crosses in the opposite direction.
⚙️ Settings Highlights
Custom Sessions: Adjust the ORB window (e.g., 5-min or 30-min).
ICT Visuals: Lighter neon green FVGs and internal box labels (+FVG, -OB).
Date Range Backtest: Define a specific start/end date for the performance stats.
Fully Configurable: Toggle every filter on or off to suit your style.
Disclaimer: Trading involves significant risk. This tool is designed to assist with confluence and data visualization, not to provide financial advice. Always practice proper risk management.
This institutional-grade breakout indicator is designed specifically for high-precision trading on indices like QQQ, SPY, and NQ. It combines the power of the 15-Minute Opening Range Breakout (ORB) with ICT PD Arrays (Fair Value Gaps & Order Blocks) and a sophisticated multi-factor confluence engine.
Unlike standard breakout indicators, this system requires price action to prove itself through institutional momentum (FVGs) and structural retests (Fibonacci Pullbacks) before issuing a signal.
🧠 Core Methodology
1. The 15-Minute Opening Range
The script automatically captures the high and low of the first 15 minutes of the New York session (09:30–09:45). These levels act as the "Battleground" for the rest of the day.
2. Institutional PD Arrays (FVG & OB)
The indicator identifies and tracks Fair Value Gaps (+/-FVG) and Order Blocks (+/-OB) using standard ICT logic.
Internal FVGs: Identifies institutional buildup inside the range before the snap.
External FVGs: Confirms institutional displacement beyond the range during the breakout.
Persistent Tracking: Boxes extend to the right automatically and are removed only when the gap is "filled" by price action.
3. Multi-Factor Confluence Dashboard
The real-time dashboard monitors 9 unique confluences to give you a "Strength Score" out of 9:
Volume & RSI: Momentum and relative strength confirmation.
MACD & EMA Cross: Trend alignment.
4H EMA: Higher Timeframe (HTF) trend filtering.
Fibonacci Pullback: Option to require a pullback to the .382, .500, or .618 levels before signal confirmation (preventing "chasing" the move).
📊 Performance Dashboard
Stop guessing which confluences work best. The built-in Performance Dashboard tracks:
Total Trades: Every signal fired within your chosen date range.
Win/Loss Record: Based on a strict 1:1 Risk/Reward logic (opposite range side as SL).
Win Rate %: Updates in real-time as you toggle confluences on or off, allowing you to find the "Sweet Spot" for the current market regime.
🛠 How to Trade This System
Establish the Range: Wait for the 15-minute box to form at the NY Open.
Monitor the Bias: The dashboard will show Long or Short Bias based on price relation to the range midline.
Check Confluences: Look for a Strength Score of 7/9 or higher.
The Retest: If enabled, wait for the price to tap the chosen Fibonacci level after the breakout.
Entry: Execute on the BUY/SELL or FLIP labels.
Exit: The script prints a clear ORANGE EXIT label when the 9/20 EMA crosses in the opposite direction.
⚙️ Settings Highlights
Custom Sessions: Adjust the ORB window (e.g., 5-min or 30-min).
ICT Visuals: Lighter neon green FVGs and internal box labels (+FVG, -OB).
Date Range Backtest: Define a specific start/end date for the performance stats.
Fully Configurable: Toggle every filter on or off to suit your style.
Disclaimer: Trading involves significant risk. This tool is designed to assist with confluence and data visualization, not to provide financial advice. Always practice proper risk management.
오픈 소스 스크립트
트레이딩뷰의 진정한 정신에 따라, 이 스크립트의 작성자는 이를 오픈소스로 공개하여 트레이더들이 기능을 검토하고 검증할 수 있도록 했습니다. 작성자에게 찬사를 보냅니다! 이 코드는 무료로 사용할 수 있지만, 코드를 재게시하는 경우 하우스 룰이 적용된다는 점을 기억하세요.

면책사항
해당 정보와 게시물은 금융, 투자, 트레이딩 또는 기타 유형의 조언이나 권장 사항으로 간주되지 않으며, 트레이딩뷰에서 제공하거나 보증하는 것이 아닙니다. 자세한 내용은 이용 약관을 참조하세요.
오픈 소스 스크립트
트레이딩뷰의 진정한 정신에 따라, 이 스크립트의 작성자는 이를 오픈소스로 공개하여 트레이더들이 기능을 검토하고 검증할 수 있도록 했습니다. 작성자에게 찬사를 보냅니다! 이 코드는 무료로 사용할 수 있지만, 코드를 재게시하는 경우 하우스 룰이 적용된다는 점을 기억하세요.
면책사항
해당 정보와 게시물은 금융, 투자, 트레이딩 또는 기타 유형의 조언이나 권장 사항으로 간주되지 않으며, 트레이딩뷰에서 제공하거나 보증하는 것이 아닙니다. 자세한 내용은 이용 약관을 참조하세요.