업데이트됨
Market Waves [BigBeluga]
MARKET WAVES
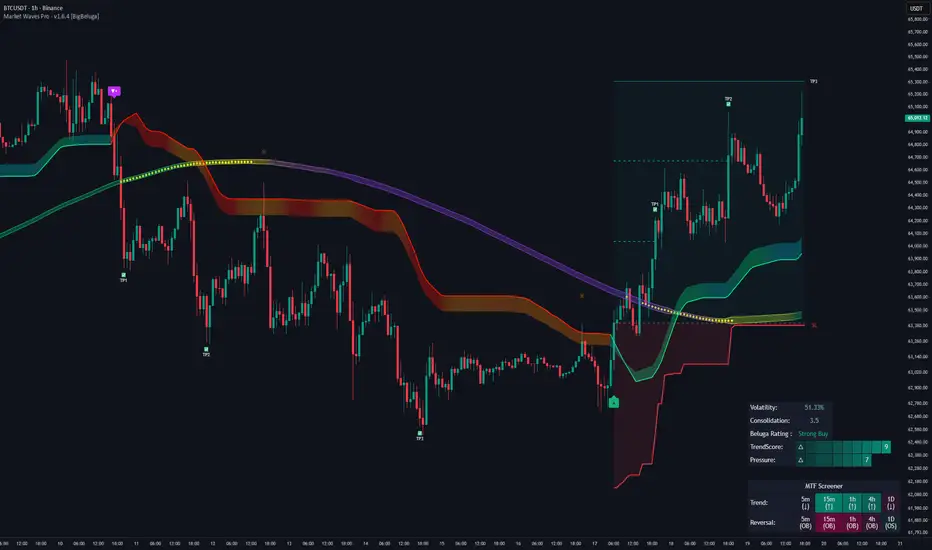
Market Waves The Market Waves [BigBeluga] is an all in one toolkit focusing on trends, accumulations and identifying market structures right on your chart. It is lightweight and powerful in its approaches, taking unique mathematical approaches to classical tools.
⬤ Signals
The Beluga Signals combine tested powerful ideas into a single tool. They are designed to follow trends and reduce noise in the market using low pass filtering methods. There are two types of signals founds in this toolkit; normal and power signals. Power signals are signals with a + in them indicating that the signal may be more likely to play out.
These are great when used in confluence with other trend following tools to filter them for even greater performance. Naturally traders will want to use these with confluence to confirm the trend identification.

The signals come with take profits built in. Ticks are placed on the chart indicating a potential areas to be taking profit. Using these as exits can be powerful especially when using confluence. Max Profit labels are also produced suggesting it really is the ideal time to be exiting the market before a reversal comes.
By leveraging unique low lag methods and filtering approaches, these signals offer a unique edge when compared to classical TSL such as a SuperTrend or PSAR.
⬤ Smooth Trend
The Smooth Trend (shown here with green and red shadows) also focuses on low lag noise filtering. This unique system is perfect when used for entries or as a filter. Users are able to adjust how fast or slow the trend is identified.

In the example above, we see a sell signal during the time the smooth trend is green. Therefore using confluence we can filter out the signal and proceed to take our power buy signal.
Percentages are also provided at the start of the trend. These indicate the probability this really is a new trend. In the image above we again see the trends are both labelled as 100% and the system is fully confident what we were seeing was indeed a trend reversal.
Although it may appear as a classical trend following tool, again it's uniqueness lies in its ability to locate market bottoms and respond to trends.
⬤ The Trend Accumulations
This feature focuses on elegant trend and range identification making trader's lives easier. By not cluttering the chart this system allows traders to see an asset's behavior without overlays.

Uptrends, downtrends and ranges are identified with uptrends showing with a green base line, downtrends with a red one and ranges/accumulations in blue. As shown in the image above; this is a powerful system to avoid trading ranges/chop in the market. We see a blue accumulation zone, this means the market is best to avoid. We then transition to a faint green suggesting the market is starting to move upwards.
Leveraging range detection techniques, this gives responsive market structure identification at a glance.
⬤ Voltix Bands
The Voltix Bands are a type of volatility-based band used to gauge market volatility and identify potential trading opportunities. These bands consist of two components: an upper band and a lower band. The distance between the bands fluctuates based on market volatility. When the market is highly volatile, the bands widen, and when volatility is low, the bands contract. They are unique as they uniquely apply distributions and weight volatility accordingly.

How to Use Voltix Bands:
When the price moves outside the Voltix Bands, it often signals a potential breakout. A close above the upper band may indicate the start of an upward trend, while a close below the lower band might signal the beginning of a downward trend.
Traders often use these breakout signals to enter trades in the direction of the breakout.
Detecting Overbought and Oversold Conditions:
When the price touches or moves beyond the upper Voltix Band, it can suggest that the market is overbought, indicating a potential reversal or pullback.
Conversely, when the price touches or drops below the lower Voltix Band, it may indicate an oversold condition, suggesting a possible price increase or trend reversal.
Volatility Contraction and Expansion:
Tightening Voltix Bands (when the bands contract) often precedes a significant price movement. This phenomenon is known as the "squeeze." When the bands tighten, it indicates a period of low volatility, and traders often anticipate an imminent breakout in either direction.
Widening Voltix Bands (when the bands expand) signal increasing volatility. Traders can use this as a cue to either ride the trend or be cautious of potential reversals.
Trend Following:
In trending markets, the price often stays close to the upper or lower band for extended periods. Traders can use this characteristic to follow the trend, staying long when the price is near the upper band and short when it is near the lower band. The bands also provide color coding and are green during an uptrend and purple during a downtrend.
⬤ Candle Coloring
1. Volume-Based Candle Coloring
Volume-based candle coloring mode changes the color of each candlestick according to the trading volume associated with that period. This method helps traders quickly identify periods of high or low market activity and understand the strength behind price movements.

How It Works:
High Volume: Candles are colored differently (red bearish, bright blue for bullish) when the trading volume is significantly higher than the average. This indicates strong buying or selling interest.
This mode is useful for identifying potential breakouts or fakeouts. For example, a price breakout accompanied by high volume suggests a strong move, while a breakout on low volume might indicate a lack of conviction, potentially leading to a false breakout.
2. Trend-Based Candle Coloring
Trend-based candle coloring mode changes the color of candlesticks depending on the current market trend, helping traders visually distinguish between bullish and bearish phases and neutral periods.

How It Works:
Bullish Trend: Candles are colored green when the price is in an uptrend.
Bearish Trend: Candles are colored red when the price is in a downtrend.
Usage:
This mode is beneficial for trend-following strategies, allowing traders to quickly assess the overall market direction and align their trades with the prevailing trend.
3. Momentum-Based Candle Coloring
In this momentum-based candle coloring mode, candlesticks are colored yellow for strong bullish momentum and pink for strong bearish momentum. This visual approach highlights the intensity of market movements, helping traders quickly identify prevailing momentum and potential trend shifts.

How It Works:
Strong Bullish Momentum (Yellow Candles):
Candles turn yellow when the market exhibits strong upward momentum. This might be triggered by a proprietary technique that detects when buying pressure is significantly driving prices higher, indicating that the market is experiencing robust bullish activity.
Yellow candles suggest that the price is likely to continue rising, and traders may look to capitalize on this momentum.
Strong Bearish Momentum (Pink Candles):
Candles turn pink when strong downward momentum is detected. The same technique identifies when selling pressure is dominant, pushing prices lower at a significant pace.
Pink candles indicate that bearish forces are strong, with the price likely to keep declining, making it a potential opportunity for short-selling or exiting long positions.

This color scheme is particularly beneficial for traders who prioritize momentum-based strategies. The clear distinction between strong bullish (yellow) and bearish (pink) momentum provides an instant visual cue, enabling quick decision-making.
Entering Trades:
Traders might choose to enter long positions when a series of yellow candles appears, indicating strong bullish momentum.
Alternatively, pink candles may signal an opportune moment to enter short positions, capturing the market's downward momentum.
Exiting Trades:
A shift from pink to yellow candles in a previously bearish trend could indicate a reversal, prompting traders to exit short positions.
The Market Waves toolkit is a powerful collection of unique and powerful tools. Please use DD when trading and always manage risk.
Market Waves The Market Waves [BigBeluga] is an all in one toolkit focusing on trends, accumulations and identifying market structures right on your chart. It is lightweight and powerful in its approaches, taking unique mathematical approaches to classical tools.
⬤ Signals
The Beluga Signals combine tested powerful ideas into a single tool. They are designed to follow trends and reduce noise in the market using low pass filtering methods. There are two types of signals founds in this toolkit; normal and power signals. Power signals are signals with a + in them indicating that the signal may be more likely to play out.
These are great when used in confluence with other trend following tools to filter them for even greater performance. Naturally traders will want to use these with confluence to confirm the trend identification.
The signals come with take profits built in. Ticks are placed on the chart indicating a potential areas to be taking profit. Using these as exits can be powerful especially when using confluence. Max Profit labels are also produced suggesting it really is the ideal time to be exiting the market before a reversal comes.
By leveraging unique low lag methods and filtering approaches, these signals offer a unique edge when compared to classical TSL such as a SuperTrend or PSAR.
⬤ Smooth Trend
The Smooth Trend (shown here with green and red shadows) also focuses on low lag noise filtering. This unique system is perfect when used for entries or as a filter. Users are able to adjust how fast or slow the trend is identified.
In the example above, we see a sell signal during the time the smooth trend is green. Therefore using confluence we can filter out the signal and proceed to take our power buy signal.
Percentages are also provided at the start of the trend. These indicate the probability this really is a new trend. In the image above we again see the trends are both labelled as 100% and the system is fully confident what we were seeing was indeed a trend reversal.
Although it may appear as a classical trend following tool, again it's uniqueness lies in its ability to locate market bottoms and respond to trends.
⬤ The Trend Accumulations
This feature focuses on elegant trend and range identification making trader's lives easier. By not cluttering the chart this system allows traders to see an asset's behavior without overlays.
Uptrends, downtrends and ranges are identified with uptrends showing with a green base line, downtrends with a red one and ranges/accumulations in blue. As shown in the image above; this is a powerful system to avoid trading ranges/chop in the market. We see a blue accumulation zone, this means the market is best to avoid. We then transition to a faint green suggesting the market is starting to move upwards.
Leveraging range detection techniques, this gives responsive market structure identification at a glance.
⬤ Voltix Bands
The Voltix Bands are a type of volatility-based band used to gauge market volatility and identify potential trading opportunities. These bands consist of two components: an upper band and a lower band. The distance between the bands fluctuates based on market volatility. When the market is highly volatile, the bands widen, and when volatility is low, the bands contract. They are unique as they uniquely apply distributions and weight volatility accordingly.
How to Use Voltix Bands:
When the price moves outside the Voltix Bands, it often signals a potential breakout. A close above the upper band may indicate the start of an upward trend, while a close below the lower band might signal the beginning of a downward trend.
Traders often use these breakout signals to enter trades in the direction of the breakout.
Detecting Overbought and Oversold Conditions:
When the price touches or moves beyond the upper Voltix Band, it can suggest that the market is overbought, indicating a potential reversal or pullback.
Conversely, when the price touches or drops below the lower Voltix Band, it may indicate an oversold condition, suggesting a possible price increase or trend reversal.
Volatility Contraction and Expansion:
Tightening Voltix Bands (when the bands contract) often precedes a significant price movement. This phenomenon is known as the "squeeze." When the bands tighten, it indicates a period of low volatility, and traders often anticipate an imminent breakout in either direction.
Widening Voltix Bands (when the bands expand) signal increasing volatility. Traders can use this as a cue to either ride the trend or be cautious of potential reversals.
Trend Following:
In trending markets, the price often stays close to the upper or lower band for extended periods. Traders can use this characteristic to follow the trend, staying long when the price is near the upper band and short when it is near the lower band. The bands also provide color coding and are green during an uptrend and purple during a downtrend.
⬤ Candle Coloring
1. Volume-Based Candle Coloring
Volume-based candle coloring mode changes the color of each candlestick according to the trading volume associated with that period. This method helps traders quickly identify periods of high or low market activity and understand the strength behind price movements.
How It Works:
High Volume: Candles are colored differently (red bearish, bright blue for bullish) when the trading volume is significantly higher than the average. This indicates strong buying or selling interest.
This mode is useful for identifying potential breakouts or fakeouts. For example, a price breakout accompanied by high volume suggests a strong move, while a breakout on low volume might indicate a lack of conviction, potentially leading to a false breakout.
2. Trend-Based Candle Coloring
Trend-based candle coloring mode changes the color of candlesticks depending on the current market trend, helping traders visually distinguish between bullish and bearish phases and neutral periods.
How It Works:
Bullish Trend: Candles are colored green when the price is in an uptrend.
Bearish Trend: Candles are colored red when the price is in a downtrend.
Usage:
This mode is beneficial for trend-following strategies, allowing traders to quickly assess the overall market direction and align their trades with the prevailing trend.
3. Momentum-Based Candle Coloring
In this momentum-based candle coloring mode, candlesticks are colored yellow for strong bullish momentum and pink for strong bearish momentum. This visual approach highlights the intensity of market movements, helping traders quickly identify prevailing momentum and potential trend shifts.
How It Works:
Strong Bullish Momentum (Yellow Candles):
Candles turn yellow when the market exhibits strong upward momentum. This might be triggered by a proprietary technique that detects when buying pressure is significantly driving prices higher, indicating that the market is experiencing robust bullish activity.
Yellow candles suggest that the price is likely to continue rising, and traders may look to capitalize on this momentum.
Strong Bearish Momentum (Pink Candles):
Candles turn pink when strong downward momentum is detected. The same technique identifies when selling pressure is dominant, pushing prices lower at a significant pace.
Pink candles indicate that bearish forces are strong, with the price likely to keep declining, making it a potential opportunity for short-selling or exiting long positions.
This color scheme is particularly beneficial for traders who prioritize momentum-based strategies. The clear distinction between strong bullish (yellow) and bearish (pink) momentum provides an instant visual cue, enabling quick decision-making.
Entering Trades:
Traders might choose to enter long positions when a series of yellow candles appears, indicating strong bullish momentum.
Alternatively, pink candles may signal an opportune moment to enter short positions, capturing the market's downward momentum.
Exiting Trades:
A shift from pink to yellow candles in a previously bearish trend could indicate a reversal, prompting traders to exit short positions.
The Market Waves toolkit is a powerful collection of unique and powerful tools. Please use DD when trading and always manage risk.
릴리즈 노트
New Features Added Alerts
릴리즈 노트
Signals Fixes릴리즈 노트
Updates: - Redesigned FlowTrend with a delta volume gauge
- Enhanced Market Dashboard with additional information
- Updated candle color calculations and refined color selection
- Added midline and additional labels to Voltix Bands
- Improved ActionWave calculations and resolved errors
릴리즈 노트
-릴리즈 노트
We have refined lots of the features , fixed minor bugs , and we added feature rich dashboard .릴리즈 노트
Fixed minor bugs and enhanced overall functionality.릴리즈 노트
Fixed minor bugs and improved Bb Rating 릴리즈 노트
- Alerts bug fix - Added optimal sensitivity
- Trend Magnet Bar toggle
릴리즈 노트
- minor bug fixes in alerts릴리즈 노트
Update HighlightsPattern Selection Control – You can now filter candlestick detections via the Pattern Display Selector setting.
- Selecting a specific pattern shows only that one on the chart.
- Choosing All displays every supported bullish and bearish pattern.
Signal outputs updated: - Bullcandle → true only when the chosen bullish pattern (or All) is detected.
- Bearcandle → true only when the chosen bearish pattern (or All) is detected.
- Flow Trend Visual Update – Improved visuals for the Flow Trend ribbon.
- Cleaner gradient coloring for trend phases.
- Sharper transitions at trend shifts.
- Stronger contrast for bullish vs. bearish states, making it easier to spot changes in market momentum.
General Performance Improvements – Optimized calculations reduce resource usage and improve responsiveness across all supported timeframes.
Alert Parser Update – The parser format has been updated to use double curly braces {{ ... }} for improved alert handling and reliability.
Automation Bot Compatibility – Replaced time with timenow, ensuring alerts and signals are compatible with automation bots and external trade execution systems.
릴리즈 노트
--릴리즈 노트
- Dynamic Take Profits logic improvement릴리즈 노트
- Dynamic TPs improvement릴리즈 노트
Market Waves 1.4.4 Update- Alert Settings Structure
- Magnet Bar display toggle
- ActionWave cross alert
- Plot name updates
- Smart Bands styling improvements
Dashboard
- Position input added for the dashboard
- Updated MTF reversal logic for dashboard
- MTF trend gradient color now reflects trend strength
릴리즈 노트
- Top centre position dashboard fix- Added Trend Signals labels size input
- Shadow input to hide smart band and general Trend signals shadow
릴리즈 노트
Update:- Voltix Bands mid line
- Minor bug fix
릴리즈 노트
- Minor bug fix릴리즈 노트
- SmartBands Retest Signal Logic improvement릴리즈 노트
Update: Trend Filters & Risk Management- New Signal Filters: Added FlowTrend, ActionWave, and TrendMagnet dropdowns to cross-verify signals and reduce market noise.
- Integrated Stop Loss: New Fixed and Trailing SL modes now available (compatible with Fixed TP mode).
- SL Alerts: Added dedicated alerts for Stop Loss hits to automate your exits.
- UI Cleanup: Streamlined settings menu and improved Smart Bands/Shadow toggles for a cleaner chart.
릴리즈 노트
-릴리즈 노트
Updated the Trend Magnet with new logic and features to help you dial in your trend detection.- New Sensitivity Modes: You can now choose between Scalp, Normal, and Macro modes. This allows the Trend Magnet band to detect trends based on your specific trading style, whether you are looking for quick moves or long-term trends.
- Custom Colors: New color inputs have been added to the settings, giving you full control over how the indicator looks on your chart.
릴리즈 노트
- Dynamic MTF Row: Toggle between FlowTrend, ActionWave, TrendMagnet, or Voltix via the new dropdown menu.
- Voltix Filtering: We've added trend signal filtering using the Voltix Trend Mid Line to ensure you only trade in the direction of the core trend.
릴리즈 노트
- DashBoard minor bug fix릴리즈 노트
Market Waves PRO — v1.6 UpdateNew Features
- VectorShift Engine Integration: A premium, adaptive tracking baseline that replaces traditional linear filters. The module uses dynamic volatility buffering to automatically give trades breathing room during early trend expansions and lock in capital tightly during overextended moves.
- Automated Consolidation Detection: When market momentum flattens or enters an equilibrium range, the tracking baseline automatically transitions into a Dotted Yellow Layout, providing immediate visual warning of low-velocity, range-bound chop.
- Multi-Horizon Sensitivity Modes: Added a dedicated parameter to toggle the computational horizon between Scalp, Normal, and Macro execution modes, aligning indicator sensitivity directly to your operational timeframe.
릴리즈 노트
Market Waves Toolkit Update: Fixed and trailing stop losses now fully support Dynamic Take Profits mode.릴리즈 노트
We have upgraded the alert settings inside Market Waves Pro to make configuration faster, cleaner, and completely error-free.- Instant Filter Options: Easily select between 🔵All, 🟢Bullish Only, or 🔴Bearish Only for structural retests and trend tools.
- Granular Entry Controls: For entry signals, choose exactly how strict you want to be right from the dropdown menu (e.g., normal Buy, high-strength Buy+, or combined execution Any Buy). Everything else can be cleanly flipped to ❌Disabled to keep your chart noise-free.
- Upgraded Interactive Tooltips: We re-wrote every single tooltip inside the alert and settings sections. Now, if you are unsure what an alert tracks or what is this input about, simply hover your mouse over the (i) info icon next to the setting for an instant, clear explanation right on your screen.
릴리즈 노트
Added a powerful upgrade to help you automate your trading and stay locked into the rhythm of the market:- Custom Step Alerts: Take full control of your notifications. You can now set up precise, multi-step alerts tailored exactly to your strategy rules so you never miss a wave.
릴리즈 노트
- minor bug fix릴리즈 노트
External Source Alerting: Added a one more "External Source" alert step to the Custom Alerts group for advanced automation confluences.릴리즈 노트
- Better Strong/Normal Signals: Upgraded how the script tells the difference between strong and normal signals based on how far the market is overextended.
- Clearer Top/Bottom signals Colors: Refined the visual alerts to match these overextended points perfectly, making the detected Top/Bottom signals much more accurate.
릴리즈 노트
- Minor bug fix릴리즈 노트
- Custom Alerts upgradeThe logic now monitors Step 1 conditions at all times.
If Step 1 triggers again before the full sequence finishes, the "Max Bars allowed between steps" input timer instantly resets to 0 and restarts from the newest trigger.
릴리즈 노트
- minor performance improvments릴리즈 노트
- minor bug fix릴리즈 노트
🔵 WHAT'S NEW IN V1.6.2Trend Signals Updates
* Enhanced Auto Optimization: Improved optimization algorithms for faster, more accurate sensitivity calculation across historical data.
Bar Magnet Enhancements: Optimized detection of Low Momentum Zones for clearer trend filtering and structural accuracy.
Trade Management Updates
- Added TP3 Target: Set up to three target profit levels (TP1, TP2, TP3) for better scale-out management.
- Organized Settings Menu: Options are now cleanly grouped under dedicated Trade Management and Trend Settings sections.
- Filled Risk Areas: Fixed Take Profits and Stop Loss levels now feature filled background colors directly on the chart for improved visual clarity.
- Historical TP Checkmarks: Fixed Take Profit levels are now plotted retroactively across historical trades with completion checkmarks.
Visual & Signal Improvements
- Cleaner FlowTrend Visuals: Redesigned FlowTrend with a smooth, premium look.
- Faster Retest Signals: Optimized retest logic for faster entries and quicker signal response time.
릴리즈 노트
Trend signals- Improved signals reaction and market noice tolerance
MTF Dashboard
- Trend Row: tooltips and arrow trend direction
- Reversals Row: tooltips and OB/OS (Overbought/OverSold) labels
Style tab
- Voltix Bands signals can be customized
- All function lines can be customized in the style tab after they are activated.
릴리즈 노트
- Minor Bug fix릴리즈 노트
Custom Alert Time Windows:Restrict custom alerts to specific trading hours to cut down off-hours noise, complete with a visual teal line at the bottom of the chart to show your active time window.
릴리즈 노트
MTF Dashboard Update: Dynamic Timeframe Scaling MatrixTo allow users to utilize the multi-timeframe dashboard seamlessly on lower chart resolutions without generating false results or structural data mismatches caused by requesting significantly higher timeframes.
- Seconds Charts (< 60s): Scales from 1s up to 1m (1S, 5S, 15S, 45S, 1m)
- 1-Minute Chart (== 60s): Scales from 5m up to 30m (5m, 10m, 15m, 20m, 30m)
- Short Intraday (<= 5m): 5m, 15m, 45m, 1h, 2h
- Medium Intraday (<= 10m): 5m, 15m, 1h, 2h, 3h
- Higher Intraday (<= 30m): 5m, 15m, 1h, 4h, 12h
- Standard / Higher Charts (> 30m): Defaults to 5m, 15m, 1h, 4h, 1D
릴리즈 노트
- Minor bug fix- Dashboard Sell/Buy Rating improvment
- Tick Chart Compatibility Fix
릴리즈 노트
- Interactive Tooltips for Trend Signals:
Hover over your trend signals to instantly see the exact signal type and price. - Dynamic Take-Profit Tooltips:
Added the exact same clean, informative tooltips to your dynamic take-profit levels as well. - Volume-Weighted Heikin Ashi Coloring:
We've introduced smart candle coloring that combines Heikin Ashi smoothing with volume data to easily spot trends, momentum, and pullbacks (using yellow for potential reversals).
릴리즈 노트
- Trend Signals filters with a built-in toggle. (No need to toggle the feature first to use the filters.)
유료 공간에서 이용 가능
이 지표는 BigBeluga Premium 구독자만 이용할 수 있습니다. 가입하여 BigBeluga의 스크립트를 포함하여 다양한 스크립트에 접근하세요.

🌐 bigbeluga.org/tv - Get access to our powerful tools & indicators.
🔵 Learn More -> docs.bigbeluga.org/
🔵 Join Discord -> go.bigbeluga.org/k65q9bfqfu
All content provided by BigBeluga is for educational purposes only
🔵 Learn More -> docs.bigbeluga.org/
🔵 Join Discord -> go.bigbeluga.org/k65q9bfqfu
All content provided by BigBeluga is for educational purposes only
면책사항
해당 정보와 게시물은 금융, 투자, 트레이딩 또는 기타 유형의 조언이나 권장 사항으로 간주되지 않으며, 트레이딩뷰에서 제공하거나 보증하는 것이 아닙니다. 자세한 내용은 이용 약관을 참조하세요.
유료 공간에서 이용 가능
이 지표는 BigBeluga Premium 구독자만 이용할 수 있습니다. 가입하여 BigBeluga의 스크립트를 포함하여 다양한 스크립트에 접근하세요.
🌐 bigbeluga.org/tv - Get access to our powerful tools & indicators.
🔵 Learn More -> docs.bigbeluga.org/
🔵 Join Discord -> go.bigbeluga.org/k65q9bfqfu
All content provided by BigBeluga is for educational purposes only
🔵 Learn More -> docs.bigbeluga.org/
🔵 Join Discord -> go.bigbeluga.org/k65q9bfqfu
All content provided by BigBeluga is for educational purposes only
면책사항
해당 정보와 게시물은 금융, 투자, 트레이딩 또는 기타 유형의 조언이나 권장 사항으로 간주되지 않으며, 트레이딩뷰에서 제공하거나 보증하는 것이 아닙니다. 자세한 내용은 이용 약관을 참조하세요.