HS SP500 1.6x Long Benchmark
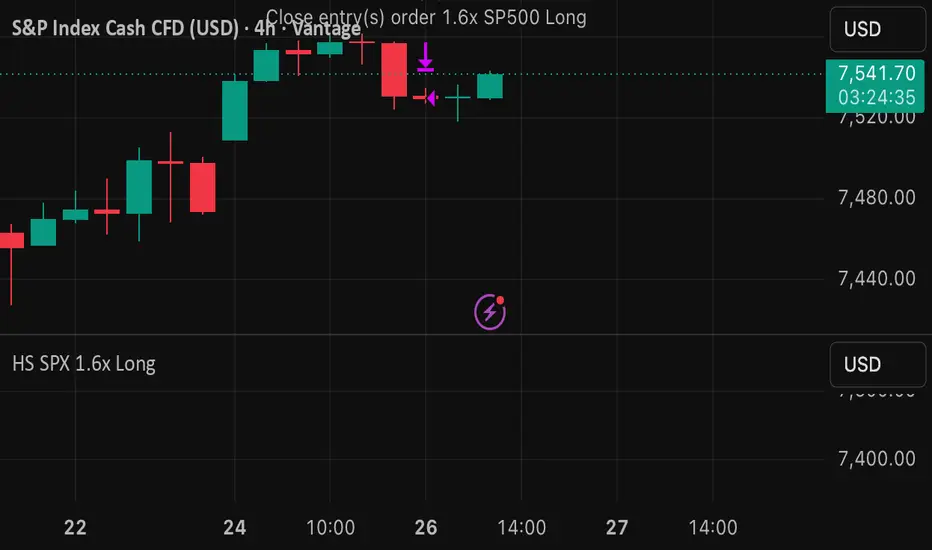
Long-only SP500 benchmark strategy using 160% notional exposure.
This is not a predictive trading signal. It is a transparent leveraged benchmark designed to compare 1.6x long SP500 exposure against TradingView’s Buy & Hold benchmark over the same historical window.
Backtest target used:
VANTAGE:SP500, 4h, Mar 16, 2018 to May 26, 2026.
The strategy models:
160% of equity position sizing, 0.075% commission, 2 ticks slippage, and 50% long margin.
Expected behavior: if applied to the same SP500 chart and date window, it should outperform 1x Buy & Hold by roughly the leverage factor, while also carrying larger drawdowns and margin risk.

면책사항
해당 정보와 게시물은 금융, 투자, 트레이딩 또는 기타 유형의 조언이나 권장 사항으로 간주되지 않으며, 트레이딩뷰에서 제공하거나 보증하는 것이 아닙니다. 자세한 내용은 이용 약관을 참조하세요.
면책사항
해당 정보와 게시물은 금융, 투자, 트레이딩 또는 기타 유형의 조언이나 권장 사항으로 간주되지 않으며, 트레이딩뷰에서 제공하거나 보증하는 것이 아닙니다. 자세한 내용은 이용 약관을 참조하세요.