OPEN-SOURCE SCRIPT
업데이트됨 HPDR Bands with projection
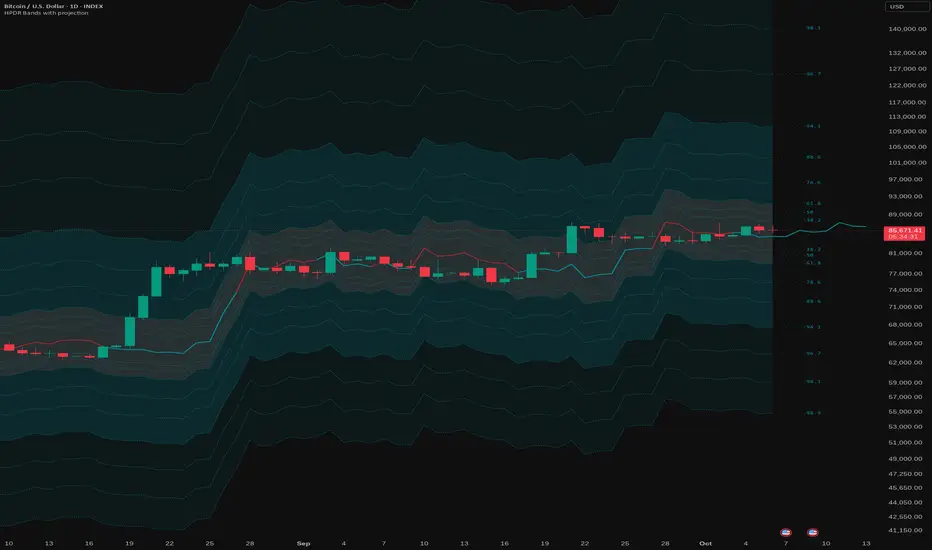
HPDR: Historical Price Delta Range
What is it? The HPDR indicator measures how much an asset’s price typically changes over a specific timeframe. It looks at historical price movements ("deltas") and organizes them into percentiles. These are then plotted on your chart as a median line surrounded by statistical bands.
This tool helps you understand an asset’s unique character and its typical price deviations.
Because the median is in this context a statistically relative stable value(if you add 7 values to 1000 it doesn't change much), it allows for high-probability projections of the future median.
For a clearer understanding of the indicator's logic, try setting the Range to 7 and the Offset to -7.
The 50% percentile Band signifies that in 50% of all bars, the price remained within this statistical range.
릴리즈 노트
- Rolling Window – Improved and streamlined historical data handling
- Color Scheme – Updated colors with better compatibility for both light and dark themes
- Code Optimization – Simplified and optimized the calculation and overall code structure
릴리즈 노트
better preview릴리즈 노트
better preview오픈 소스 스크립트
트레이딩뷰의 진정한 정신에 따라, 이 스크립트의 작성자는 이를 오픈소스로 공개하여 트레이더들이 기능을 검토하고 검증할 수 있도록 했습니다. 작성자에게 찬사를 보냅니다! 이 코드는 무료로 사용할 수 있지만, 코드를 재게시하는 경우 하우스 룰이 적용된다는 점을 기억하세요.

면책사항
해당 정보와 게시물은 금융, 투자, 트레이딩 또는 기타 유형의 조언이나 권장 사항으로 간주되지 않으며, 트레이딩뷰에서 제공하거나 보증하는 것이 아닙니다. 자세한 내용은 이용 약관을 참조하세요.
오픈 소스 스크립트
트레이딩뷰의 진정한 정신에 따라, 이 스크립트의 작성자는 이를 오픈소스로 공개하여 트레이더들이 기능을 검토하고 검증할 수 있도록 했습니다. 작성자에게 찬사를 보냅니다! 이 코드는 무료로 사용할 수 있지만, 코드를 재게시하는 경우 하우스 룰이 적용된다는 점을 기억하세요.
면책사항
해당 정보와 게시물은 금융, 투자, 트레이딩 또는 기타 유형의 조언이나 권장 사항으로 간주되지 않으며, 트레이딩뷰에서 제공하거나 보증하는 것이 아닙니다. 자세한 내용은 이용 약관을 참조하세요.