OPEN-SOURCE SCRIPT
업데이트됨 Supertrend Oscillator | TR
🎯 Overview
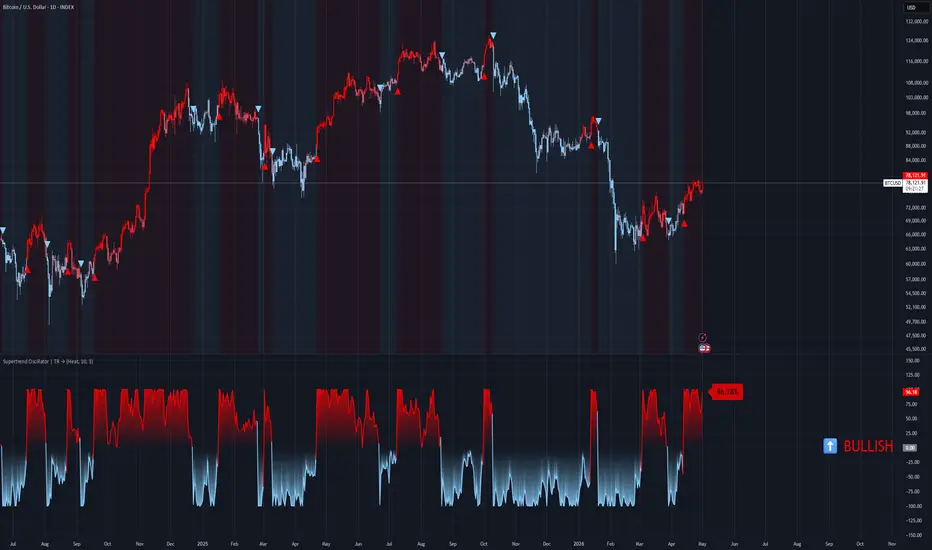
Supertrend Oscillator transforms the classic Supertrend (which plots a directional line on price) into a bounded oscillator that ranges from -100% to +100%. It measures how far price is from the Supertrend line relative to the ATR‑based bandwidth, giving a clear, normalised view of trend strength. The indicator keeps all the familiar Supertrend logic but adds gradient candle coloring, dynamic fills, nine color themes, entry signals, and a persistent trend table – turning a trend‑following line into a full visual momentum system.
⚙️ Core Calculations
1. Standard Supertrend
Source: hl2 (high+low / 2)
ATR Period: default 10
Factor: default 3
The Supertrend line and direction (pineDir) are computed using the classic Pine Script logic:
pineDir = -1 → uptrend (price above Supertrend)
pineDir = +1 → downtrend (price below Supertrend)
2. Oscillator (%)
Uptrend (pineDir = -1): positive values (0 to +100)
Downtrend (pineDir = +1): negative values (0 to -100)
The result is clamped to [-100, +100].
3. Normalised Percent (0..1)
Over the last 70 bars, percent is re‑scaled to a 0–1 range. Used for gradient candle coloring (smooth transition between bearish and bullish theme colors).
4. Momentum & Fill Transparency
Momentum = absolute 5‑bar change of percent
Normalised over a 50‑bar max → normMomentum
Fill transparency = 35 - (normMomentum × 25) clamped 0–100
→ Higher momentum = less transparent (more visible fill).
🎨 Visual Features
9 Color Themes
Same palette as the previous Williams %R indicator:
Classic, Modern, Heat, Robust, Accented, Monochrome, Moderate, Aqua, Cosmic.
Each theme defines UpC (bullish color) and DnC (bearish color).
Gradient Candles
Candle color interpolates between DnC and UpC based on the normalised percent.
Overlay on the price chart (plotcandle).
Dynamic Fills (between oscillator and zero line)
Overbought fill (percent > 0) – gradient from solid UpC (at +100) to transparent (at 0)
Oversold fill (percent < 0) – gradient from transparent (at 0) to solid DnC (at -100)
Trend‑direction fill – only fills the side of the current trend (bullish or bearish), with momentum‑based transparency. Higher momentum = less transparent.
Supertrend Overlay (optional)
Plot Chart toggle (false by default). When enabled, plots the classic Supertrend lines directly on the price pane:
Uptrend line (green) when pineDir = -1
Downtrend line (red) when pineDir = +1
Signal Markers
LONG (Bull_Cross): percent crosses above zero → green triangle below bar.
SHORT (Bear_Cross): percent crosses below zero → red triangle above bar.
Background Tint
Very light bullish / bearish tint matching the active trend.
Trend Table (middle‑right corner)
Shows “BULLISH” (⬆️) or “BEARISH” (⬇️) in large colored text.
Floating Value Label
On the last bar, shows the current percent value (e.g., 42.35%) near the oscillator line, with a semi‑transparent background matching the trend color.
📈 Signal System
Entry Signals
LONG (Bull_Cross): percent crosses above 0
→ Occurs when price moves from below Supertrend to above it, pushing the oscillator from negative into positive territory.
SHORT (Bear_Cross): percent crosses below 0
Trend Persistence
Trend_Supertrend stores the last confirmed direction:
1 = bullish (percent > 0)
-1 = bearish (percent < 0)
The trend state only changes on a zero‑line cross – prevents flickering near the threshold.
Overbought / Oversold Interpretation
+100 → price is exactly one ATR‑bandwidth above the Supertrend (strong uptrend).
-100 → price is exactly one ATR‑bandwidth below the Supertrend (strong downtrend).
Crossing zero indicates the price has just crossed the Supertrend line – a classic reversal signal.
Divergence Possibility
Although not explicitly coded, the oscillator’s raw percent value can be used to spot divergences:
Price makes a higher high but percent makes a lower high → bearish divergence.
Price makes a lower low but percent makes a higher low → bullish divergence.
Supertrend Oscillator transforms the classic Supertrend (which plots a directional line on price) into a bounded oscillator that ranges from -100% to +100%. It measures how far price is from the Supertrend line relative to the ATR‑based bandwidth, giving a clear, normalised view of trend strength. The indicator keeps all the familiar Supertrend logic but adds gradient candle coloring, dynamic fills, nine color themes, entry signals, and a persistent trend table – turning a trend‑following line into a full visual momentum system.
⚙️ Core Calculations
1. Standard Supertrend
Source: hl2 (high+low / 2)
ATR Period: default 10
Factor: default 3
The Supertrend line and direction (pineDir) are computed using the classic Pine Script logic:
pineDir = -1 → uptrend (price above Supertrend)
pineDir = +1 → downtrend (price below Supertrend)
2. Oscillator (%)
Uptrend (pineDir = -1): positive values (0 to +100)
Downtrend (pineDir = +1): negative values (0 to -100)
The result is clamped to [-100, +100].
3. Normalised Percent (0..1)
Over the last 70 bars, percent is re‑scaled to a 0–1 range. Used for gradient candle coloring (smooth transition between bearish and bullish theme colors).
4. Momentum & Fill Transparency
Momentum = absolute 5‑bar change of percent
Normalised over a 50‑bar max → normMomentum
Fill transparency = 35 - (normMomentum × 25) clamped 0–100
→ Higher momentum = less transparent (more visible fill).
🎨 Visual Features
9 Color Themes
Same palette as the previous Williams %R indicator:
Classic, Modern, Heat, Robust, Accented, Monochrome, Moderate, Aqua, Cosmic.
Each theme defines UpC (bullish color) and DnC (bearish color).
Gradient Candles
Candle color interpolates between DnC and UpC based on the normalised percent.
Overlay on the price chart (plotcandle).
Dynamic Fills (between oscillator and zero line)
Overbought fill (percent > 0) – gradient from solid UpC (at +100) to transparent (at 0)
Oversold fill (percent < 0) – gradient from transparent (at 0) to solid DnC (at -100)
Trend‑direction fill – only fills the side of the current trend (bullish or bearish), with momentum‑based transparency. Higher momentum = less transparent.
Supertrend Overlay (optional)
Plot Chart toggle (false by default). When enabled, plots the classic Supertrend lines directly on the price pane:
Uptrend line (green) when pineDir = -1
Downtrend line (red) when pineDir = +1
Signal Markers
LONG (Bull_Cross): percent crosses above zero → green triangle below bar.
SHORT (Bear_Cross): percent crosses below zero → red triangle above bar.
Background Tint
Very light bullish / bearish tint matching the active trend.
Trend Table (middle‑right corner)
Shows “BULLISH” (⬆️) or “BEARISH” (⬇️) in large colored text.
Floating Value Label
On the last bar, shows the current percent value (e.g., 42.35%) near the oscillator line, with a semi‑transparent background matching the trend color.
📈 Signal System
Entry Signals
LONG (Bull_Cross): percent crosses above 0
→ Occurs when price moves from below Supertrend to above it, pushing the oscillator from negative into positive territory.
SHORT (Bear_Cross): percent crosses below 0
Trend Persistence
Trend_Supertrend stores the last confirmed direction:
1 = bullish (percent > 0)
-1 = bearish (percent < 0)
The trend state only changes on a zero‑line cross – prevents flickering near the threshold.
Overbought / Oversold Interpretation
+100 → price is exactly one ATR‑bandwidth above the Supertrend (strong uptrend).
-100 → price is exactly one ATR‑bandwidth below the Supertrend (strong downtrend).
Crossing zero indicates the price has just crossed the Supertrend line – a classic reversal signal.
Divergence Possibility
Although not explicitly coded, the oscillator’s raw percent value can be used to spot divergences:
Price makes a higher high but percent makes a lower high → bearish divergence.
Price makes a lower low but percent makes a higher low → bullish divergence.
릴리즈 노트
Debug오픈 소스 스크립트
트레이딩뷰의 진정한 정신에 따라, 이 스크립트의 작성자는 이를 오픈소스로 공개하여 트레이더들이 기능을 검토하고 검증할 수 있도록 했습니다. 작성자에게 찬사를 보냅니다! 이 코드는 무료로 사용할 수 있지만, 코드를 재게시하는 경우 하우스 룰이 적용된다는 점을 기억하세요.

면책사항
해당 정보와 게시물은 금융, 투자, 트레이딩 또는 기타 유형의 조언이나 권장 사항으로 간주되지 않으며, 트레이딩뷰에서 제공하거나 보증하는 것이 아닙니다. 자세한 내용은 이용 약관을 참조하세요.
오픈 소스 스크립트
트레이딩뷰의 진정한 정신에 따라, 이 스크립트의 작성자는 이를 오픈소스로 공개하여 트레이더들이 기능을 검토하고 검증할 수 있도록 했습니다. 작성자에게 찬사를 보냅니다! 이 코드는 무료로 사용할 수 있지만, 코드를 재게시하는 경우 하우스 룰이 적용된다는 점을 기억하세요.
면책사항
해당 정보와 게시물은 금융, 투자, 트레이딩 또는 기타 유형의 조언이나 권장 사항으로 간주되지 않으며, 트레이딩뷰에서 제공하거나 보증하는 것이 아닙니다. 자세한 내용은 이용 약관을 참조하세요.