업데이트됨
Expiry Cycle Statistics
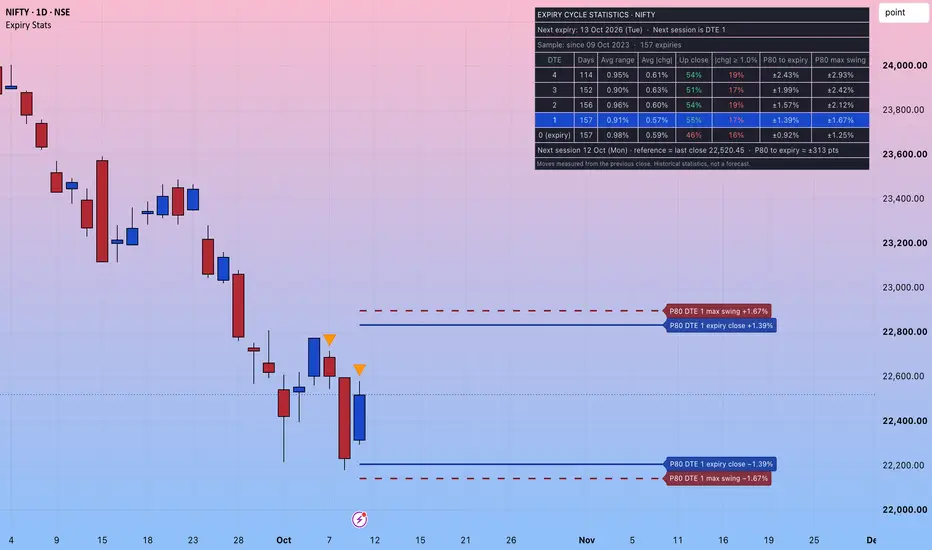
Expiry Cycle Statistics
OVERVIEW
This script measures how NIFTY and SENSEX have historically behaved at each stage of their weekly options expiry cycle. Every completed trading day is grouped by its number of trading days to the next weekly expiry (DTE 0 to 4), and the results are summarised in a table. Optional lines show the historical percentile levels for the current day around the previous close.
The script answers questions such as:
- How large is the typical daily range on an expiry day compared with two or three days before expiry?
- From the start of a given DTE day, how far has the index usually been from the previous close by the expiry-day close?
- How far has it usually swung, above or below the previous close, before that expiry?
HOW IT WORKS
1. Index detection
The script detects whether the chart shows NIFTY or SENSEX (index or continuous futures) and applies that index's weekly expiry schedule. On any other symbol it shows a message asking to open a NIFTY or SENSEX chart and draws nothing.
2. Expiry schedule
The weekday on which weekly contracts expired has changed over time. The following history is built in:
- NIFTY: Thursday (weekly options from 11 Feb 2019), Tuesday from 1 Sep 2025.
- SENSEX: Friday (weekly contracts from 15 May 2023), Tuesday from 1 Jan 2025, Thursday from 1 Sep 2025.
Days before weekly options existed for the index are excluded from the statistics.
3. Finding past expiry days
Past expiry days are identified from the price data itself. For each calendar week, the expiry is the last trading day on or before the scheduled weekday. Expiries that were moved earlier because of an exchange holiday are therefore placed on the correct day without needing a historical holiday list.
4. Measuring each day
For every completed day, the script records its trading days to the next expiry (DTE) and calculates:
- Day range: (high − low) ÷ previous close
- Close-to-close change: close ÷ previous close − 1
- Move to expiry: the absolute change from the previous close to the expiry-day close
- Maximum swing: the largest distance from the previous close reached by any high or low from that day up to and including the expiry day
5. Today
During market hours the current day's DTE row is highlighted. Outside market hours, from midnight IST, the script shows the next trading session's DTE and uses the last close as the reference. Upcoming exchange holidays can be entered so that the current DTE is correct in holiday weeks.
All values use completed daily bars only, so historical results do not repaint.
TABLE COLUMNS
- DTE: trading days to the next weekly expiry (0 = expiry day)
- Days: number of days in the sample for that DTE
- Avg range: average day range as a % of the previous close
- Avg |chg|: average absolute close-to-close change
- Up close: share of days that closed above the previous close
- |chg| ≥ X%: share of days whose absolute change was at least the chosen threshold
- Pxx to expiry: chosen percentile of the absolute move from the previous close to the expiry-day close
- Pxx max swing: chosen percentile of the maximum swing before the expiry close
The row below the table compares today's range so far with the average for today's DTE, and converts the percentile move to expiry into index points from the previous close.
CHART LINES (OPTIONAL)
- Dotted line: the reference close (previous close, or the last close outside market hours)
- Solid lines: reference ± the percentile move to expiry for the current DTE
- Dashed lines: reference ± the percentile maximum swing for the current DTE
SETTINGS
- Upcoming exchange holidays (YYYY-MM-DD, comma separated). Only used for the current DTE.
- Look-back in years
- Percentile (50, 70, 80, 90 or 95)
- Threshold for the "|chg| ≥ X%" column
- Show or hide the chart lines and the max-swing lines, and how far they extend to the right
- All colours, line widths, label sizes, table position and text size
HOW TO USE
- Use the Daily timeframe for the longest and most reliable sample. On intraday timeframes the sample is limited to the history loaded on the chart.
- Check the "Days" column. Small samples, such as SENSEX in its early history or DTE rows affected by holiday weeks, are less reliable.
- Changing the look-back period shows how behaviour differs across market conditions.
LIMITATIONS
- Statistics describe past behaviour only. Market conditions, volatility regimes and exchange rules change, and past distributions may not repeat.
- Percentiles are calculated from a limited number of expiries and should be read as approximate.
- The weekly expiry schedule is built into the script. If an exchange changes its expiry day again, the script will need an update.
- Index data may differ slightly between data sources.
DISCLAIMER
This script is published for educational and informational purposes only. It does not provide trading or investment advice, recommendations or signals to buy or sell any security, futures or options contract. Past performance and historical statistics do not guarantee future results. Trading in derivatives involves substantial risk of loss. Users are solely responsible for their own trading decisions and should consult a qualified financial adviser where appropriate.
OVERVIEW
This script measures how NIFTY and SENSEX have historically behaved at each stage of their weekly options expiry cycle. Every completed trading day is grouped by its number of trading days to the next weekly expiry (DTE 0 to 4), and the results are summarised in a table. Optional lines show the historical percentile levels for the current day around the previous close.
The script answers questions such as:
- How large is the typical daily range on an expiry day compared with two or three days before expiry?
- From the start of a given DTE day, how far has the index usually been from the previous close by the expiry-day close?
- How far has it usually swung, above or below the previous close, before that expiry?
HOW IT WORKS
1. Index detection
The script detects whether the chart shows NIFTY or SENSEX (index or continuous futures) and applies that index's weekly expiry schedule. On any other symbol it shows a message asking to open a NIFTY or SENSEX chart and draws nothing.
2. Expiry schedule
The weekday on which weekly contracts expired has changed over time. The following history is built in:
- NIFTY: Thursday (weekly options from 11 Feb 2019), Tuesday from 1 Sep 2025.
- SENSEX: Friday (weekly contracts from 15 May 2023), Tuesday from 1 Jan 2025, Thursday from 1 Sep 2025.
Days before weekly options existed for the index are excluded from the statistics.
3. Finding past expiry days
Past expiry days are identified from the price data itself. For each calendar week, the expiry is the last trading day on or before the scheduled weekday. Expiries that were moved earlier because of an exchange holiday are therefore placed on the correct day without needing a historical holiday list.
4. Measuring each day
For every completed day, the script records its trading days to the next expiry (DTE) and calculates:
- Day range: (high − low) ÷ previous close
- Close-to-close change: close ÷ previous close − 1
- Move to expiry: the absolute change from the previous close to the expiry-day close
- Maximum swing: the largest distance from the previous close reached by any high or low from that day up to and including the expiry day
5. Today
During market hours the current day's DTE row is highlighted. Outside market hours, from midnight IST, the script shows the next trading session's DTE and uses the last close as the reference. Upcoming exchange holidays can be entered so that the current DTE is correct in holiday weeks.
All values use completed daily bars only, so historical results do not repaint.
TABLE COLUMNS
- DTE: trading days to the next weekly expiry (0 = expiry day)
- Days: number of days in the sample for that DTE
- Avg range: average day range as a % of the previous close
- Avg |chg|: average absolute close-to-close change
- Up close: share of days that closed above the previous close
- |chg| ≥ X%: share of days whose absolute change was at least the chosen threshold
- Pxx to expiry: chosen percentile of the absolute move from the previous close to the expiry-day close
- Pxx max swing: chosen percentile of the maximum swing before the expiry close
The row below the table compares today's range so far with the average for today's DTE, and converts the percentile move to expiry into index points from the previous close.
CHART LINES (OPTIONAL)
- Dotted line: the reference close (previous close, or the last close outside market hours)
- Solid lines: reference ± the percentile move to expiry for the current DTE
- Dashed lines: reference ± the percentile maximum swing for the current DTE
SETTINGS
- Upcoming exchange holidays (YYYY-MM-DD, comma separated). Only used for the current DTE.
- Look-back in years
- Percentile (50, 70, 80, 90 or 95)
- Threshold for the "|chg| ≥ X%" column
- Show or hide the chart lines and the max-swing lines, and how far they extend to the right
- All colours, line widths, label sizes, table position and text size
HOW TO USE
- Use the Daily timeframe for the longest and most reliable sample. On intraday timeframes the sample is limited to the history loaded on the chart.
- Check the "Days" column. Small samples, such as SENSEX in its early history or DTE rows affected by holiday weeks, are less reliable.
- Changing the look-back period shows how behaviour differs across market conditions.
LIMITATIONS
- Statistics describe past behaviour only. Market conditions, volatility regimes and exchange rules change, and past distributions may not repeat.
- Percentiles are calculated from a limited number of expiries and should be read as approximate.
- The weekly expiry schedule is built into the script. If an exchange changes its expiry day again, the script will need an update.
- Index data may differ slightly between data sources.
DISCLAIMER
This script is published for educational and informational purposes only. It does not provide trading or investment advice, recommendations or signals to buy or sell any security, futures or options contract. Past performance and historical statistics do not guarantee future results. Trading in derivatives involves substantial risk of loss. Users are solely responsible for their own trading decisions and should consult a qualified financial adviser where appropriate.
릴리즈 노트
Update 11 Oct 2026- Bar Replay support: in replay mode, or when the last bar is more than a few days old, the table and chart lines now use that bar's own date as "today" instead of jumping to the next real-world session.
- Cleaner chart: input values no longer appear in the status line next to the indicator name.
No change to any calculation or statistic.

면책사항
해당 정보와 게시물은 금융, 투자, 트레이딩 또는 기타 유형의 조언이나 권장 사항으로 간주되지 않으며, 트레이딩뷰에서 제공하거나 보증하는 것이 아닙니다. 자세한 내용은 이용 약관을 참조하세요.
면책사항
해당 정보와 게시물은 금융, 투자, 트레이딩 또는 기타 유형의 조언이나 권장 사항으로 간주되지 않으며, 트레이딩뷰에서 제공하거나 보증하는 것이 아닙니다. 자세한 내용은 이용 약관을 참조하세요.