HTF Fractals
HTF Fractals
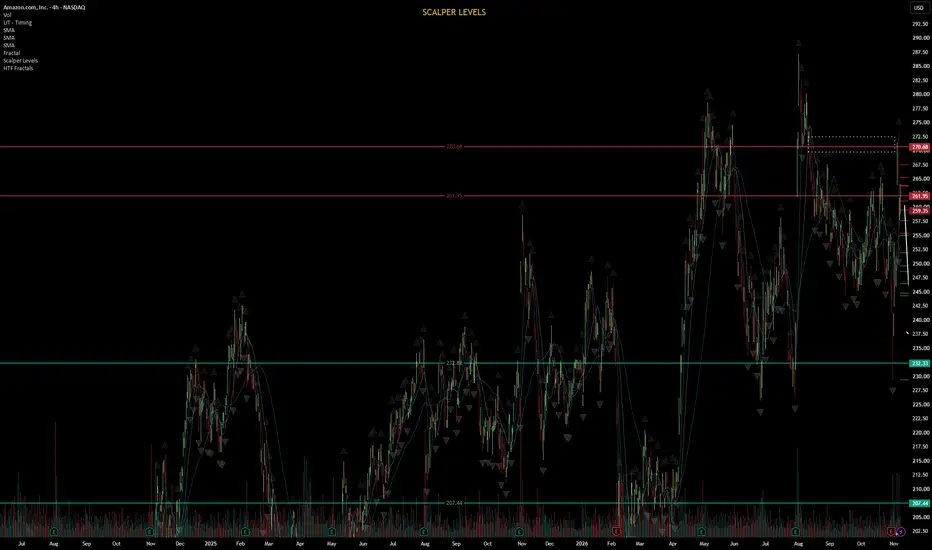
Displays Higher Timeframe (HTF) Williams Fractals directly on your lower timeframe chart as clean horizontal lines.
Features:
Plots confirmed fractal highs and lows from any higher timeframe (Daily, 4H, 1H, etc.)
Adjustable fractal strength — control how many bars are required on each side (classic Williams = 2)
Limits the number of levels shown to keep the chart clean
Fully customizable colors, line width, and whether lines extend to the right
Non-repainting on historical data
How to use:
Set your desired Higher Timeframe in the settings
Adjust “Bars each side” to control fractal sensitivity
The most recent HTF fractal highs (red) and lows (green) will appear as horizontal levels on your chart
Useful for identifying higher timeframe support/resistance and key swing points while trading on lower timeframes.
Displays Higher Timeframe (HTF) Williams Fractals directly on your lower timeframe chart as clean horizontal lines.
Features:
Plots confirmed fractal highs and lows from any higher timeframe (Daily, 4H, 1H, etc.)
Adjustable fractal strength — control how many bars are required on each side (classic Williams = 2)
Limits the number of levels shown to keep the chart clean
Fully customizable colors, line width, and whether lines extend to the right
Non-repainting on historical data
How to use:
Set your desired Higher Timeframe in the settings
Adjust “Bars each side” to control fractal sensitivity
The most recent HTF fractal highs (red) and lows (green) will appear as horizontal levels on your chart
Useful for identifying higher timeframe support/resistance and key swing points while trading on lower timeframes.

면책사항
해당 정보와 게시물은 금융, 투자, 트레이딩 또는 기타 유형의 조언이나 권장 사항으로 간주되지 않으며, 트레이딩뷰에서 제공하거나 보증하는 것이 아닙니다. 자세한 내용은 이용 약관을 참조하세요.
면책사항
해당 정보와 게시물은 금융, 투자, 트레이딩 또는 기타 유형의 조언이나 권장 사항으로 간주되지 않으며, 트레이딩뷰에서 제공하거나 보증하는 것이 아닙니다. 자세한 내용은 이용 약관을 참조하세요.