OPEN-SOURCE SCRIPT
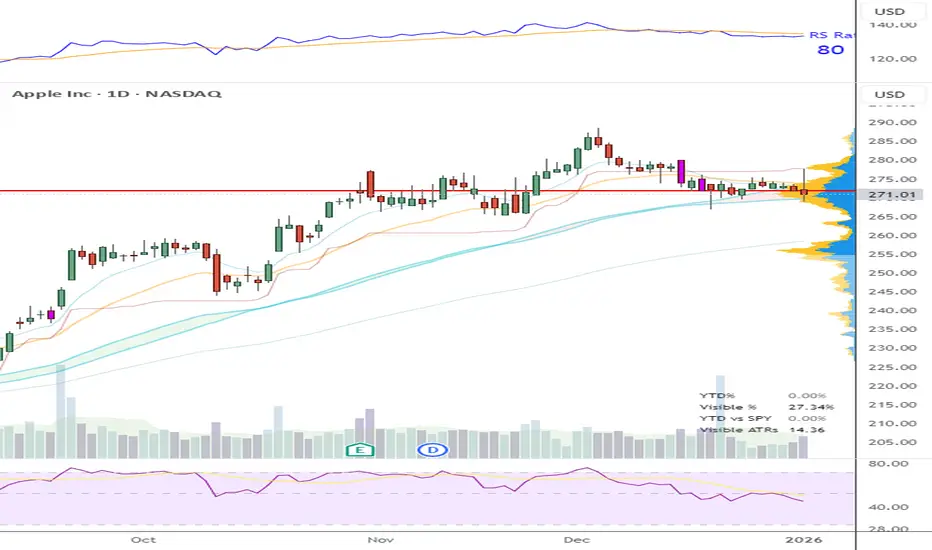
YTD % / Visible Range % Table
AUTHOR: Brandon Gum
DATE: 2026-01-03
// PURPOSE:
// Calculates price-range metrics based on the *currently visible*
// portion of the chart. Intended for table-based UI display where
// values must be stable and evaluated only on the last bar.
//
// Originally based on Jeff Sun's ADR price data table.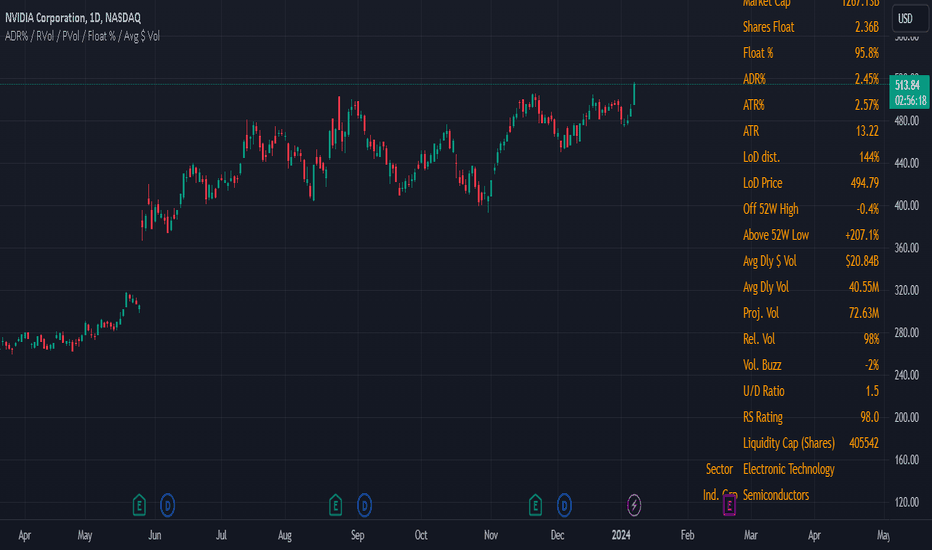
//
// METRICS RETURNED:
// - Visible High
// - Visible Low
// - Visible % Range = (Visible High - Visible Low) / Visible Low
// - Visible ATRs = (Visible High - Visible Low) / ATR
//
// IMPLEMENTATION NOTES:
// - Logic executes ONLY on barstate.islast to avoid state corruption.
// - Visible range is recomputed atomically using a backward loop
// bounded by chart.left_visible_bar_time.
// - Avoids var-based accumulation and bar-by-bar resets, which are
// unreliable when visible window changes.
// - ATR is evaluated at the current bar (not averaged over range).
//
// ASSUMPTIONS / LIMITATIONS:
// - Uses chart-visible time boundaries supplied by TradingView.
// - Loop upper bound must be sufficiently large to cover max
// expected visible bars.
// - Intended for display purposes, not signal generation.
//
// SIDE EFFECTS:
// - None. No plots, no drawings, no state persistence.
DATE: 2026-01-03
// PURPOSE:
// Calculates price-range metrics based on the *currently visible*
// portion of the chart. Intended for table-based UI display where
// values must be stable and evaluated only on the last bar.
//
// Originally based on Jeff Sun's ADR price data table.
//
// METRICS RETURNED:
// - Visible High
// - Visible Low
// - Visible % Range = (Visible High - Visible Low) / Visible Low
// - Visible ATRs = (Visible High - Visible Low) / ATR
//
// IMPLEMENTATION NOTES:
// - Logic executes ONLY on barstate.islast to avoid state corruption.
// - Visible range is recomputed atomically using a backward loop
// bounded by chart.left_visible_bar_time.
// - Avoids var-based accumulation and bar-by-bar resets, which are
// unreliable when visible window changes.
// - ATR is evaluated at the current bar (not averaged over range).
//
// ASSUMPTIONS / LIMITATIONS:
// - Uses chart-visible time boundaries supplied by TradingView.
// - Loop upper bound must be sufficiently large to cover max
// expected visible bars.
// - Intended for display purposes, not signal generation.
//
// SIDE EFFECTS:
// - None. No plots, no drawings, no state persistence.
오픈 소스 스크립트
트레이딩뷰의 진정한 정신에 따라, 이 스크립트의 작성자는 이를 오픈소스로 공개하여 트레이더들이 기능을 검토하고 검증할 수 있도록 했습니다. 작성자에게 찬사를 보냅니다! 이 코드는 무료로 사용할 수 있지만, 코드를 재게시하는 경우 하우스 룰이 적용된다는 점을 기억하세요.

-If you find this idea interesting please leave a like
-Follow for more
-Comments are always welcomed and appreciated
-Follow for more
-Comments are always welcomed and appreciated
면책사항
해당 정보와 게시물은 금융, 투자, 트레이딩 또는 기타 유형의 조언이나 권장 사항으로 간주되지 않으며, 트레이딩뷰에서 제공하거나 보증하는 것이 아닙니다. 자세한 내용은 이용 약관을 참조하세요.
오픈 소스 스크립트
트레이딩뷰의 진정한 정신에 따라, 이 스크립트의 작성자는 이를 오픈소스로 공개하여 트레이더들이 기능을 검토하고 검증할 수 있도록 했습니다. 작성자에게 찬사를 보냅니다! 이 코드는 무료로 사용할 수 있지만, 코드를 재게시하는 경우 하우스 룰이 적용된다는 점을 기억하세요.
-If you find this idea interesting please leave a like
-Follow for more
-Comments are always welcomed and appreciated
-Follow for more
-Comments are always welcomed and appreciated
면책사항
해당 정보와 게시물은 금융, 투자, 트레이딩 또는 기타 유형의 조언이나 권장 사항으로 간주되지 않으며, 트레이딩뷰에서 제공하거나 보증하는 것이 아닙니다. 자세한 내용은 이용 약관을 참조하세요.