9 Custom Horizontal Levels + Text Labels
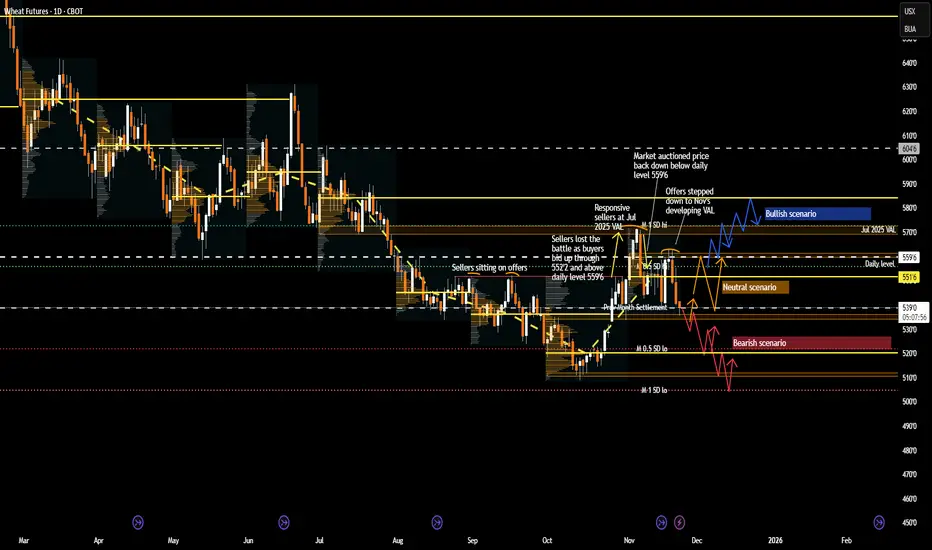
This tool provides nine fully customizable price levels for volatility-based analysis.
Each line allows manual price input and independent control of visibility, color, and style.
Common uses include constructing volatility bands such as ±1 SD and ±2 SD around a settlement or reference price. Traders can quickly map key levels, visualize market structure, and adapt the lines to fit any strategy.
Each line allows manual price input and independent control of visibility, color, and style.
Common uses include constructing volatility bands such as ±1 SD and ±2 SD around a settlement or reference price. Traders can quickly map key levels, visualize market structure, and adapt the lines to fit any strategy.

EdgeClear
P: 773.832.8320
Derivatives trading involves a substantial risk of loss. Past performance is not indicative of future results. Any example trades are not inclusive of fees and commissions.
P: 773.832.8320
Derivatives trading involves a substantial risk of loss. Past performance is not indicative of future results. Any example trades are not inclusive of fees and commissions.
면책사항
해당 정보와 게시물은 금융, 투자, 트레이딩 또는 기타 유형의 조언이나 권장 사항으로 간주되지 않으며, 트레이딩뷰에서 제공하거나 보증하는 것이 아닙니다. 자세한 내용은 이용 약관을 참조하세요.
면책사항
해당 정보와 게시물은 금융, 투자, 트레이딩 또는 기타 유형의 조언이나 권장 사항으로 간주되지 않으며, 트레이딩뷰에서 제공하거나 보증하는 것이 아닙니다. 자세한 내용은 이용 약관을 참조하세요.