OPEN-SOURCE SCRIPT
Tension Flow RR [JOAT]
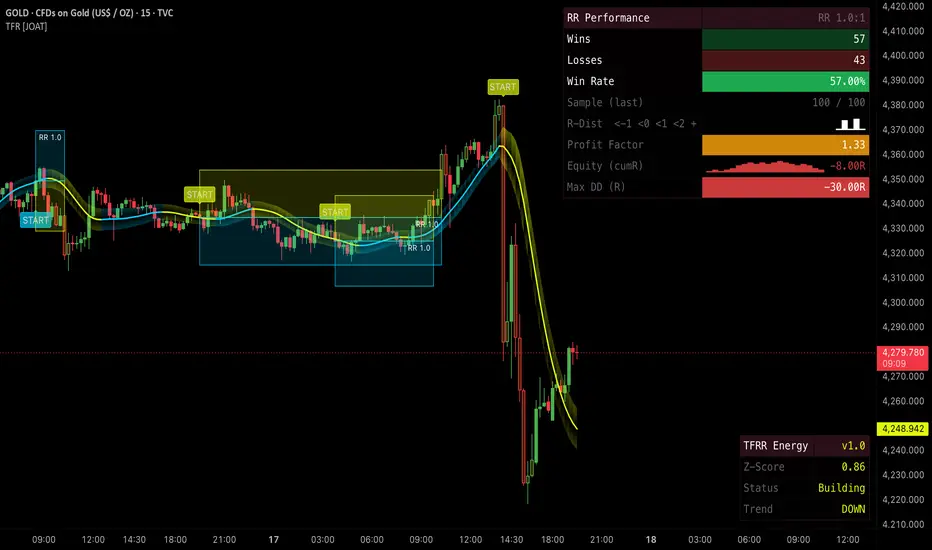
TENSION FLOW RR [JOAT]
A trend-signal engine wrapped in a full risk-reward execution layer — Hull Moving Average baseline, Z-score normalised tension reading, ATR-sized stops and targets, optional R-multiple-triggered trailing stop, and a rolling-window backtest that tracks every closed trade and reports win rate / cumulative R / equity sparkline directly on the chart. Built for traders who care about what happens after the signal fires, not just the signal itself.
Trend signal — HMA + Z-score tension
Two cleanly chosen primitives:
A new trend signal fires when the configured signal cooldown has elapsed and the directional logic flips. The signal is non-repainting (confirmed on bar close).

ATR-sized stops and targets
Each signal automatically renders:
This is full execution geometry — you can see entry, stop, target, and the trail's path on the chart at all times.
Rolling-window backtest (the headline)
The script tracks the last N closed trades (configurable, default 100) and produces live performance statistics that update tick-by-tick:
Trades are evicted FIFO when the history window is exceeded, so the win rate is always a rolling read of recent performance, not lifetime stats — which is the right read for a working trader.
Two dashboards
Both are independently positionable, sizeable, and toggle-able. The split lets you run "engine state" on one corner and "PnL state" on the other without overlap.
Trend ribbon
The HMA is rendered with an ATR-band ribbon (configurable width) whose transparency is dynamically modulated by current Z-score — the ribbon visually breathes with tension. Toggle off if you prefer a clean line.
Alerts
Alert conditions are exposed for new signals, SL hits, TP hits, trailing-stop hits, overextension events, and two win-rate threshold alerts: Win-Rate High (crossover above the configured high level) and Win-Rate Low (crossunder below the configured low level). Win-rate alerts are suppressed until a minimum sample size has been recorded, so you do not get a 100% win-rate alert from a single lucky trade.
How to read it
The script is designed to be used as a closed loop:
The cumulative-R sparkline is the most honest single line on the dashboard — if it is climbing, the engine is doing its job; if it is grinding flat or down, it isn't, and you should re-evaluate parameters or stand aside.
Suggested settings
Defaults (HMA 50, Z 50, 2.0 R-stop, 1.0 R-target) are calibrated for 1H–4H on liquid markets. For lower timeframes drop both lengths proportionally and consider a Risk:Reward above 1.0 to offset the higher signal frequency. For daily and above, raise lengths and lower the signal cooldown.
Originality / what's reused
HMA, Z-score, and ATR-sized stops are public-domain primitives, used here as building blocks. The implementation — the Z-normalised tension reading, the R-multiple activation trailing stop with break-even lock, the colour-coded rolling-N backtest, the Unicode equity sparkline rendered inside table cells, the dual-dashboard split, and the sample-gated win-rate alerts — is JOAT-original and tuned together. No third-party code reused.
Open source
Published open-source under the default Mozilla Public License 2.0. The execution geometry, the rolling-trade tracker, the Z-modulated ribbon, and the sparkline renderer are each isolated so you can adapt any one without reading the whole file. Forks welcome with credit.
Limitations
The rolling backtest is a descriptive read of recent signal performance under the current settings — it is not a predictive metric and changing the parameters resets the read. SL / TP geometry assumes a single position per signal direction; the script is not a position manager. Trailing stop fires on confirmed bars; intra-bar movement past the trail level is registered but the close determines the outcome.
—
-made with passion by jackofalltrades
A trend-signal engine wrapped in a full risk-reward execution layer — Hull Moving Average baseline, Z-score normalised tension reading, ATR-sized stops and targets, optional R-multiple-triggered trailing stop, and a rolling-window backtest that tracks every closed trade and reports win rate / cumulative R / equity sparkline directly on the chart. Built for traders who care about what happens after the signal fires, not just the signal itself.
Trend signal — HMA + Z-score tension
Two cleanly chosen primitives:
- Hull Moving Average (HMA) — a chained-WMA construct that delivers a fast, low-lag trend baseline. The square-root final smoothing step is what makes it noticeably less laggy than EMA at the same length.
- Z-score of (close − HMA) — the residual is normalised by its own rolling stdev so the tension reading is dimensionless and comparable across instruments. |Z| above the overextended threshold (default 2.0) tags the move as overextended in the Energy Dashboard.
A new trend signal fires when the configured signal cooldown has elapsed and the directional logic flips. The signal is non-repainting (confirmed on bar close).
ATR-sized stops and targets
Each signal automatically renders:
- SL box — a translucent box sized at SL-ATR × multiplier (default 2.0 × ATR-200) from entry, drawn in the bear colour.
- TP box — sized at SL distance × Risk:Reward ratio (default 1.0R), drawn in the bull colour.
- Trailing-stop line (optional, JOAT enhancement) — when enabled and price moves more than the activation threshold (in R-multiples) in your favour, the stop ratchets behind price by Trail-ATR × multiplier. Configurable bar-by-bar trail step, optional break-even lock at activation.
This is full execution geometry — you can see entry, stop, target, and the trail's path on the chart at all times.
Rolling-window backtest (the headline)
The script tracks the last N closed trades (configurable, default 100) and produces live performance statistics that update tick-by-tick:
- Total trades, wins, losses, breakevens.
- Win rate, with colour-coded cell — green above the configured "green" threshold, amber between, red below.
- Average R per trade, best R, worst R.
- Cumulative R since the start of the window.
- Profit factor.
- Expectancy in R-multiples.
- Unicode equity sparkline — a compact in-cell chart of the last N cumulative-R points, drawn directly in the dashboard cells with block-character glyphs.
Trades are evicted FIFO when the history window is exceeded, so the win rate is always a rolling read of recent performance, not lifetime stats — which is the right read for a working trader.
Two dashboards
- Energy Dashboard (Bottom-Right by default) — compact 22-row read of current Z-score, trend direction, HMA value, overextension flag, ribbon width, ATR, and signal state.
- RR Performance Dashboard (Top-Right by default) — 29-row institutional read of the rolling backtest stats above, plus the equity sparkline.
Both are independently positionable, sizeable, and toggle-able. The split lets you run "engine state" on one corner and "PnL state" on the other without overlap.
Trend ribbon
The HMA is rendered with an ATR-band ribbon (configurable width) whose transparency is dynamically modulated by current Z-score — the ribbon visually breathes with tension. Toggle off if you prefer a clean line.
Alerts
Alert conditions are exposed for new signals, SL hits, TP hits, trailing-stop hits, overextension events, and two win-rate threshold alerts: Win-Rate High (crossover above the configured high level) and Win-Rate Low (crossunder below the configured low level). Win-rate alerts are suppressed until a minimum sample size has been recorded, so you do not get a 100% win-rate alert from a single lucky trade.
How to read it
The script is designed to be used as a closed loop:
- Take the trend-start signal as the entry. The HMA + Z-score logic is the signal; the SL/TP boxes are the geometry.
- If trailing is enabled, the line will appear once unrealised PnL exceeds the activation threshold and will ratchet from there.
- When the trade closes, the rolling backtest updates — watch the win-rate colour and the cumulative-R sparkline.
- If win-rate trips the low alert, that is the script telling you the current regime does not suit the current settings.
The cumulative-R sparkline is the most honest single line on the dashboard — if it is climbing, the engine is doing its job; if it is grinding flat or down, it isn't, and you should re-evaluate parameters or stand aside.
Suggested settings
Defaults (HMA 50, Z 50, 2.0 R-stop, 1.0 R-target) are calibrated for 1H–4H on liquid markets. For lower timeframes drop both lengths proportionally and consider a Risk:Reward above 1.0 to offset the higher signal frequency. For daily and above, raise lengths and lower the signal cooldown.
Originality / what's reused
HMA, Z-score, and ATR-sized stops are public-domain primitives, used here as building blocks. The implementation — the Z-normalised tension reading, the R-multiple activation trailing stop with break-even lock, the colour-coded rolling-N backtest, the Unicode equity sparkline rendered inside table cells, the dual-dashboard split, and the sample-gated win-rate alerts — is JOAT-original and tuned together. No third-party code reused.
Open source
Published open-source under the default Mozilla Public License 2.0. The execution geometry, the rolling-trade tracker, the Z-modulated ribbon, and the sparkline renderer are each isolated so you can adapt any one without reading the whole file. Forks welcome with credit.
Limitations
The rolling backtest is a descriptive read of recent signal performance under the current settings — it is not a predictive metric and changing the parameters resets the read. SL / TP geometry assumes a single position per signal direction; the script is not a position manager. Trailing stop fires on confirmed bars; intra-bar movement past the trail level is registered but the close determines the outcome.
—
-made with passion by jackofalltrades
오픈 소스 스크립트
트레이딩뷰의 진정한 정신에 따라, 이 스크립트의 작성자는 이를 오픈소스로 공개하여 트레이더들이 기능을 검토하고 검증할 수 있도록 했습니다. 작성자에게 찬사를 보냅니다! 이 코드는 무료로 사용할 수 있지만, 코드를 재게시하는 경우 하우스 룰이 적용된다는 점을 기억하세요.

The Institutional Grade Trading Ecosystem, Built to win trades 📈
Get Access 👇
jackofalltrades.vip 🌐
t.me/jackofalltradesvip 🃏
Get Access 👇
jackofalltrades.vip 🌐
t.me/jackofalltradesvip 🃏
면책사항
해당 정보와 게시물은 금융, 투자, 트레이딩 또는 기타 유형의 조언이나 권장 사항으로 간주되지 않으며, 트레이딩뷰에서 제공하거나 보증하는 것이 아닙니다. 자세한 내용은 이용 약관을 참조하세요.
오픈 소스 스크립트
트레이딩뷰의 진정한 정신에 따라, 이 스크립트의 작성자는 이를 오픈소스로 공개하여 트레이더들이 기능을 검토하고 검증할 수 있도록 했습니다. 작성자에게 찬사를 보냅니다! 이 코드는 무료로 사용할 수 있지만, 코드를 재게시하는 경우 하우스 룰이 적용된다는 점을 기억하세요.
The Institutional Grade Trading Ecosystem, Built to win trades 📈
Get Access 👇
jackofalltrades.vip 🌐
t.me/jackofalltradesvip 🃏
Get Access 👇
jackofalltrades.vip 🌐
t.me/jackofalltradesvip 🃏
면책사항
해당 정보와 게시물은 금융, 투자, 트레이딩 또는 기타 유형의 조언이나 권장 사항으로 간주되지 않으며, 트레이딩뷰에서 제공하거나 보증하는 것이 아닙니다. 자세한 내용은 이용 약관을 참조하세요.